Top 100 Most Populous Cities Around the World (2025–2026): What the Numbers Reveal About the New Urban World
We see that more than half of humanity’s urban story can be understood in one clear idea: the worlds biggest cities are no longer just special cases. They are now the pattern of how people live.
The newest 2025–2026 population data from this VizAtlas ranking puts the 100 cities at the heart of a huge crowd of people. All 100 cities together hold about 1.041 billion people. The average size of a ranked city is 10.41 million but the middle city size is only about 7.07 million.
That difference shows a lot about city size.
A few huge city groups pull up the average while more cities have between four and ten million residents. The worlds city hierarchy is not a step ladder. It looks like mountains of people followed by a long busy tail of big cities.
The size of the places is hard to picture. The biggest city in the dataset has about 41.9 million people— ten times the population of the city ranked 100 which has about 4.28 million.
This is no longer a story about cities. It is a story, about how humanity’s rearranging itself.
What Does “Most Populous City” Actually Mean?
Counting people seems simple until the question is: where does the city end?
A municipal boundary, an urban area, a metropolitan region and an urban agglomeration can lead to very different numbers for the same place.
This is one of the important issues in any global city ranking.
The United Nations World Urbanization Prospects 2025 clearly points out the challenge of comparing cities around the world because countries define areas in different ways. Some use boundaries, while others look at population density, economic features or physical characteristics of the city. The 2025 update introduced the harmonised Degree of Urbanization approach to make international comparisons easier.
The dataset used for this VizAtlas ranking uses the general approach for international comparisons focusing on population numbers for large urban areas rather than just using a citys official borders as the only way to measure it.
That difference changes the map a lot.
A city is not the buildings inside a political line. In a metropolis people who live in the suburbs those who travel to work small towns nearby industrial areas and other cities close, by can create one big economic and population system.
The population of the city is therefore describing an urban living thing.
The Scale of the Top 100 Is Extraordinary
The 100 cities in the dataset together have 1,041,301,406 people. That is more than one billion people all gathered in just 100 city areas.
This number should not be seen as one billion people living in the same kind of city. The cities are very different in size, how crowded they are, the buildings and roads, types of jobs people do and how they are officially defined.
Even so, the total shows something very strong about how people live in groups.
The number of people living in cities is becoming more and more important when looking at the worlds population. According to the United Nations 2025 update cities have 45% of all the people on Earth with the total population being 8.2 billion. That percentage of people in cities has more than doubled since 1950, when around 20% of people lived in cities.
The top 100 cities by themselves hold 12.7% of the worlds total population using the United Nations 8.2-billion number. That is an amount. One hundred places hold than one out of every eight people, on the planet.
The Biggest Cities Are Getting Really Big
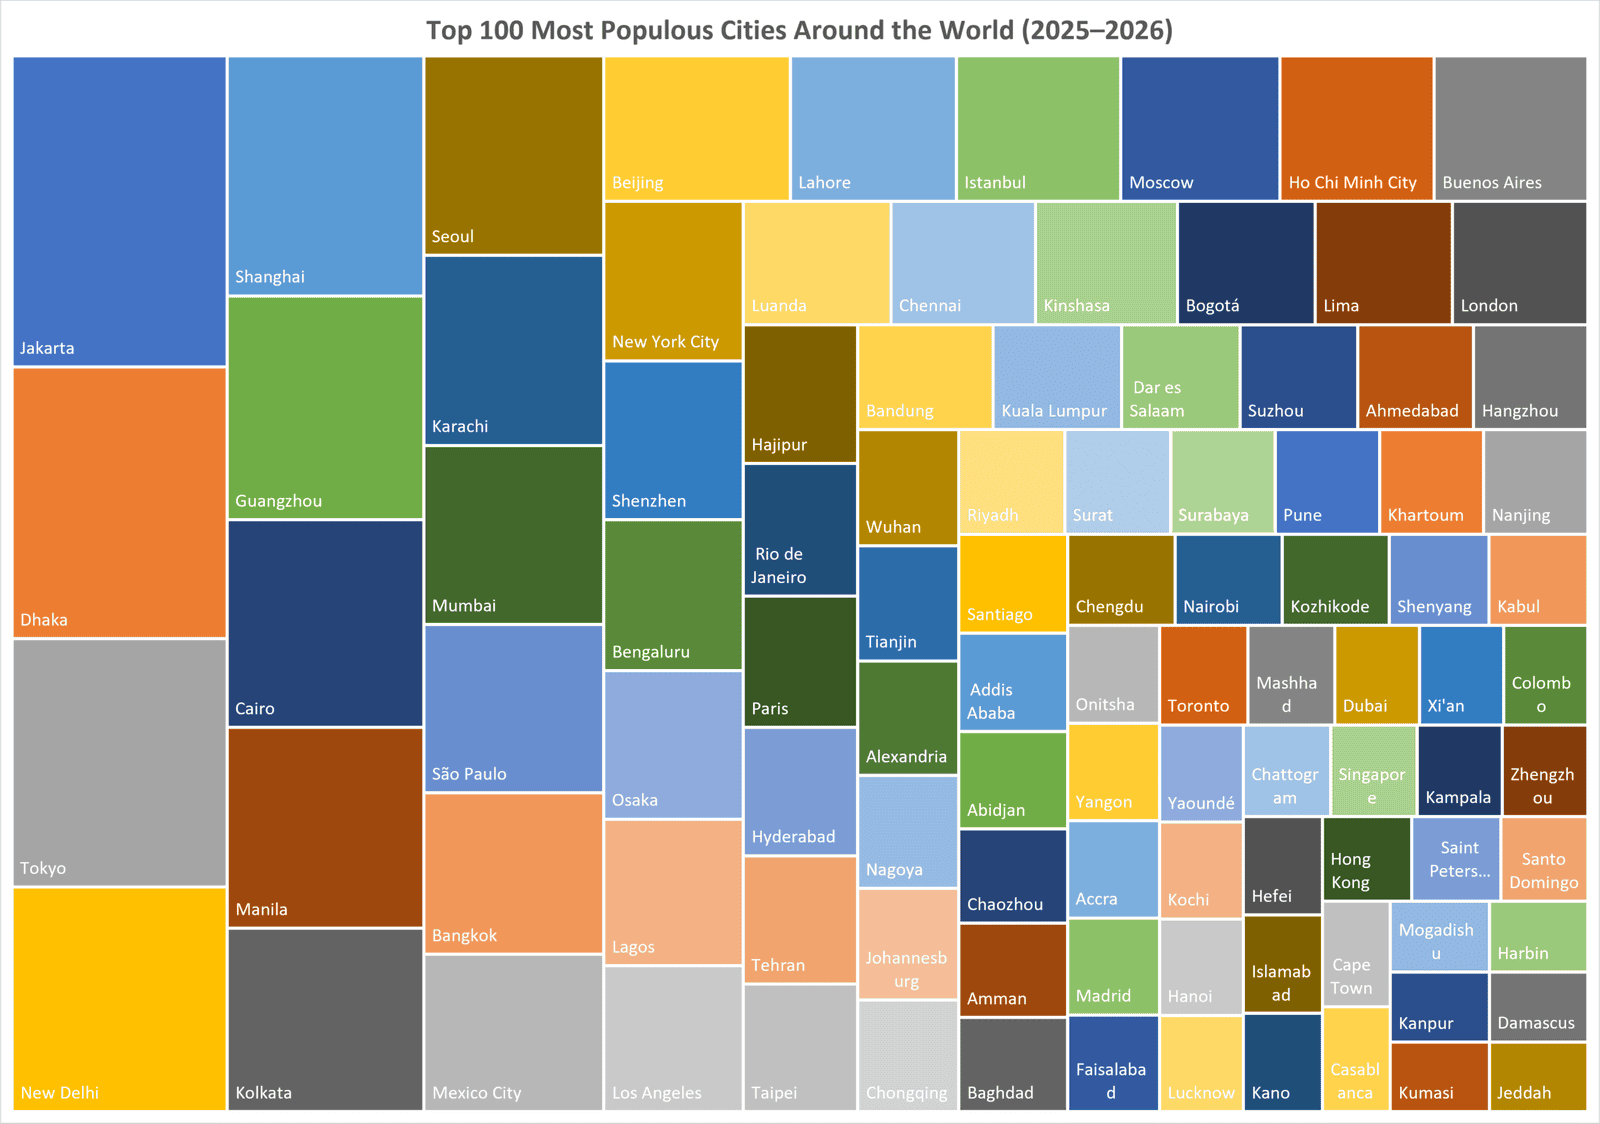
The first thing you notice about the dataset is how big the numbers are at the top. The main city has around 41.9 million people. The second one has 36.6 million. The third one has than 33.4 million. The fourth one is over 30.2 million. The fifth is close to 29.6 million. The sixth one is still above 27.5 million. The seventh is more than 25.5 million. When you get to the tenth one, the population is still about 22.5 million.
This means the top ten are not big cities in the usual way. They are groups of people living together like an entire countries.
| Rank | City | Country | Population Value |
|---|---|---|---|
| 1 | Jakarta | Indonesia | 41,913,860 |
| 2 | Dhaka | Bangladesh | 36,585,479 |
| 3 | Tokyo | Japan | 33,412,512 |
| 4 | New Delhi | India | 30,222,405 |
| 5 | Shanghai | China | 29,558,908 |
| 6 | Guangzhou | China | 27,563,372 |
| 7 | Cairo | Egypt | 25,566,102 |
| 8 | Manila | Philippines | 24,735,305 |
| 9 | Kolkata | India | 22,549,738 |
| 10 | Seoul | South Korea | 22,490,482 |
| 11 | Karachi | Pakistan | 21,422,590 |
| 12 | Mumbai | India | 20,203,056 |
| 13 | São Paulo | Brazil | 18,949,790 |
| 14 | Bangkok | Thailand | 18,180,280 |
| 15 | Mexico City | Mexico | 17,734,212 |
| 16 | Beijing | China | 17,013,303 |
| 17 | Lahore | Pakistan | 15,156,430 |
| 18 | Istanbul | Türkiye | 15,014,763 |
| 19 | Moscow | Russia | 14,524,753 |
| 20 | Ho Chi Minh City | Vietnam | 14,052,713 |
| 21 | Buenos Aires | Argentina | 14,017,736 |
| 22 | New York City | United States | 13,920,148 |
| 23 | Shenzhen | China | 13,878,396 |
| 24 | Bengaluru | India | 13,187,098 |
| 25 | Osaka | Japan | 12,964,145 |
| 26 | Lagos | Nigeria | 12,791,699 |
| 27 | Los Angeles | United States | 12,740,420 |
| 28 | Luanda | Angola | 11,370,127 |
| 29 | Chennai | India | 11,153,205 |
| 30 | Kinshasa | Democratic Republic of the Congo | 10,943,641 |
| 31 | Bogotá | Colombia | 10,624,315 |
| 32 | Lima | Peru | 10,580,241 |
| 33 | London | United Kingdom | 10,416,420 |
| 34 | Hajipur | India | 9,941,510 |
| 35 | Rio de Janeiro | Brazil | 9,500,336 |
| 36 | Paris | France | 9,381,921 |
| 37 | Hyderabad | India | 9,190,795 |
| 38 | Tehran | Iran | 9,174,964 |
| 39 | Taipei | Taiwan | 9,136,792 |
| 40 | Bandung | Indonesia | 8,909,104 |
| 41 | Kuala Lumpur | Malaysia | 8,443,731 |
| 42 | Dar es Salaam | Tanzania | 7,795,114 |
| 43 | Suzhou | China | 7,731,101 |
| 44 | Ahmedabad | India | 7,632,408 |
| 45 | Hangzhou | China | 7,500,208 |
| 46 | Wuhan | China | 7,363,548 |
| 47 | Tianjin | China | 7,285,342 |
| 48 | Alexandria | Egypt | 7,266,957 |
| 49 | Nagoya | Japan | 7,146,160 |
| 50 | Johannesburg | South Africa | 7,077,175 |
| 51 | Chongqing | China | 7,071,073 |
| 52 | Riyadh | Saudi Arabia | 6,916,417 |
| 53 | Surat | India | 6,908,925 |
| 54 | Surabaya | Indonesia | 6,843,503 |
| 55 | Pune | India | 6,817,951 |
| 56 | Khartoum | Sudan | 6,809,355 |
| 57 | Nanjing | China | 6,800,676 |
| 58 | Santiago | Chile | 6,726,045 |
| 59 | Addis Ababa | Ethiopia | 6,705,705 |
| 60 | Abidjan | Côte d’Ivoire | 6,621,711 |
| 61 | Chaozhou | China | 6,407,770 |
| 62 | Amman | Jordan | 6,403,666 |
| 63 | Baghdad | Iraq | 6,390,735 |
| 64 | Chengdu | China | 6,139,874 |
| 65 | Nairobi | Kenya | 6,134,334 |
| 66 | Kozhikode | India | 6,123,872 |
| 67 | Shenyang | China | 5,702,638 |
| 68 | Kabul | Afghanistan | 5,635,737 |
| 69 | Onitsha | Nigeria | 5,627,706 |
| 70 | Yangon | Myanmar | 5,618,303 |
| 71 | Accra | Ghana | 5,592,780 |
| 72 | Madrid | Spain | 5,583,601 |
| 73 | Faisalabad | Pakistan | 5,566,382 |
| 74 | Toronto | Canada | 5,494,431 |
| 75 | Mashhad | Iran | 5,398,248 |
| 76 | Dubai | United Arab Emirates | 5,283,789 |
| 77 | Xi’an | China | 5,231,053 |
| 78 | Colombo | Sri Lanka | 5,223,838 |
| 79 | Yaoundé | Cameroon | 5,106,087 |
| 80 | Kochi | India | 5,077,670 |
| 81 | Hanoi | Vietnam | 5,068,414 |
| 82 | Lucknow | India | 5,052,444 |
| 83 | Chattogram | Bangladesh | 4,983,553 |
| 84 | Singapore | Singapore | 4,963,998 |
| 85 | Kampala | Uganda | 4,880,943 |
| 86 | Zhengzhou | China | 4,878,035 |
| 87 | Hefei | China | 4,867,000 |
| 88 | Islamabad | Pakistan | 4,860,084 |
| 89 | Kano | Nigeria | 4,840,280 |
| 90 | Hong Kong | China | 4,749,543 |
| 91 | Saint Petersburg | Russia | 4,736,499 |
| 92 | Santo Domingo | Dominican Republic | 4,600,064 |
| 93 | Cape Town | South Africa | 4,508,921 |
| 94 | Casablanca | Morocco | 4,457,471 |
| 95 | Mogadishu | Somalia | 4,399,430 |
| 96 | Harbin | China | 4,376,259 |
| 97 | Kanpur | India | 4,329,973 |
| 98 | Kumasi | Ghana | 4,297,984 |
| 99 | Damascus | Syria | 4,287,746 |
| 100 | Jeddah | Saudi Arabia | 4,284,080 |
Twelve Cities Have More Than 20 Million People
The threshold analysis becomes more revealing.
Of the 100 cities in the dataset: 12 have populations above 20 million. Another six sit between 15 and 20 million. That means 18 of the world’s 100 cities exceed 15 million inhabitants.
The concentration does not stop there. A total of 33 cities have populations above 10 million. In words roughly one-third of the entire ranking consists of urban centres that have crossed the traditional “megacity” threshold of 10 million residents.
The United Nations reports that the number of megacities— areas with at least 10 million inhabitants—has increased dramatically rising from only eight in 1975 to 33 in 2025. More than half of those megacities are located in Asia.
The VizAtlas dataset therefore captures something larger than a list of big cities. It captures the emergence of a world where urban gigantism is becoming increasingly normal.
The Average Is Misleading— That Is the Point
The average population across the 100 cities is 10.41 million. The median is only about 7.07 million.
Why does that matter?
Because the difference demonstrates how strongly the largest cities distort the average. A handful of urban populations push the mean upward. The typical city in the ranking is therefore considerably smaller than the average suggests.
This is an example of why data journalism should never rely on one summary statistic.
Imagine describing the dataset by saying that the “average population is 10.4 million.” A reader might reasonably imagine that most cities contain around ten million people. They do not. The distribution is more uneven.
At the end of the ranking every city still has more than 4.28 million residents but the population falls substantially from the extraordinary levels recorded at the top.
The result resembles a pyramid: a narrow group of urban giants at the summit followed by a much broader collection of very large cities.
Top 10 Account for Three in Every Ten People in the Dataset
The concentration becomes even clearer when the populations are added together.
The top ten cities contain 294.6 million people. That represents 28.3% of the population of all 100 cities. So the ten largest urban centres account for three out of every ten people represented in this ranking.
The top 20 contain 466.9 million people, equivalent, to about 44.8% of the entire top-100 population. That means than one-fifth of the cities account for nearly half of the population represented by the ranking. Urban hierarchy is therefore highly unequal. The largest cities do not simply sit above the others. They operate on a different demographic scale.
A City Is More Than Its Population
A city is more than population.
Population is one of the powerful indicators of urban scale but population is not the same as urban importance.
We believe a city of five million people can have economic influence. We think a city of fifteen million can struggle with infrastructure. We feel a smaller city can have a role, as a financial political, technological or cultural centre. We believe this is why population rankings should not be confused with rankings of the worlds important cities.
The present index answers one question:
Where is the largest concentrations of people?
It does not answer:
Where is the productive city?
Where is the wealthiest city?
Where is the liveable city?
Where is the growing city?
Where is the technologically advanced city?
Those are different questions I believe and sometimes the answers overlaps. Sometimes they do not.
Density Changes the Meaning of “Large”
There is another big problem with just looking at total numbers of people. Two cities can each have ten million people, while taking up very different amounts of space.
One might look like a tight group of buildings. The other might spread out over hundreds or even thousands of kilometers.
The United Nations 2025 update is very helpful here because for the time it includes consistent information about city size and built-up areas along with population numbers. This lets researchers look at not how many people live in cities but also how much land urban areas take up.
This is important because the future of cities will depend not on more people but on how well cities can hold that growth.
Ten million people can need different buildings and services depending on how they are spread out.
The Bottom of the 100 Is Still Very Big
One thing people often miss in the list is the population of the city at number 100. The last city in the list has about 4.28 million people.
That means the line to get into the Top 100 is already as big as a large national city area. The 100th city is not small in any sense. It is very big.
This shows how much the list of cities has grown.
The difference between a city and a megacity is not good enough anymore to describe the middle part of the worlds cities.
Even cities that are not usually called megacities, can have populations like countries and can have very complex economies.
The Main Trend: Cities Are Getting More Concentrated, But Not All the Same
The main trend in the 2025–2026 data is not just that cities are growing. It is that people are living more and more in connected city areas. The biggest cities are taking in people, money, buildings and business activity. This does not mean that every city is growing at the same speed.
Some areas are growing quickly.
Some are staying the same.
Some are getting older.
Some are growing because people move in.
Others are spreading out more than their people are increasing.
This makes a world where urbanization means different things, depending on where you are and how developed the city is.
That is why the UNs 2025 way of looking at things focuses more on different ways to define cities. Different countries have ideas, about what counts as a city, making it hard to compare them.
Better ways to define cities lead to comparisons.
Better comparisons show clearer patterns.
The Future Will Be More Urban
The most important story may not be found in the 2025-26 numbers at all. It lies ahead.
The United Nations projects that two-thirds of population growth through 2050 will happen in cities with most of the rest growing in towns. This means future population growth will increasingly become a planning problem.
Where will people live?
How will they travel?
Where will water come from?
How will electricity demand be met?
How will cities manage waste?
How will housing remain affordable?
How will public transport keep pace?
How will cities deal with heat and flooding?
How will informal settlements be integrated into urban systems?
These questions are no side issues. They are becoming questions about the future of humanity.
The Megacity Challenge Is Really an Infrastructure Challenge
Population growth itself is not necessarily a problem. Managed population growth is.
A city can absorb millions of residents if housing, transport, sanitation, energy, healthcare, education and employment expand alongside the population.
When population growth consistently outruns infrastructure investment the consequences can be severe.
Traffic increases.
Housing becomes scarce.
Commutes lengthen.
Informal settlements expand.
Water systems become stressed
Air pollution can worsen.
Public services become harder to deliver.
The population number therefore needs to be interpreted alongside capacity. A city with 20 million residents is not automatically dysfunctional. It simply has a complicated management problem.
Increasingly, the world’s largest urban areas are learning to manage problems at a scale previously associated with entire nations.
What the Data Does Not Tell Us
A population ranking can tell us where enormous numbers of people live.
But It cannot tell us whether those people are prosperous.
It cannot tell us whether housing is affordable.
It cannot tell us whether transport is efficient.
It cannot tell us how crowded individual neighbourhoods are.
It cannot distinguish wealth from poverty.
It cannot tell us whether population growth is creating opportunity or pressure.
The UN explicitly warns that urban settlements can change definition over time as administrative boundaries expand neighbouring settlements. Statistical systems change. Historical estimates may therefore need to be adjusted to maintain consistency.
The 2025 UN revision attempts to improve this comparability through the Degree of Urbanization framework and expanded geospatial analysis while retaining national-definition estimates where appropriate.
This is why a difference of a hundred thousand people, between two international city estimates should not automatically be interpreted as a real demographic discrepancy.
Sometimes the difference is methodological.
The boundary moved.
The definition changed.
The statistical model improved.
The city did not suddenly lose half a million people overnight.
Conclusion: The Future of Population Is Urban
The Top 100 Most Populous Cities Around the World (2025–2026) ranking is far more than a list of huge city populations. It is a snapshot of a shift in human geography.
The 100 cities in the dataset hold than 1.04 billion people. Twelve of those cities have than 20 million inhabitants. Thirty-three of those cities have than 10 million inhabitants. The top ten cities alone comprise 28.3% of the people in the ranking while the top twenty cities hold 44.8%.
At the time the difference between the largest city and the smallest city in the top 100 is huge: about 41.9 million people compared to 4.28 million people.
These numbers show a world where city size is becoming unprecedented. The most important insight is not that cities are growing larger. It is that humans are putting more of their future inside city systems.
The cities of tomorrow must take in people while also facing climate change, housing pressure, infrastructure needs, inequality, congestion, energy changes and new technology.
The winners of this century will not necessarily be the cities that grow the biggest. It will be the cities that can grow more productive, more connected, more resilient and more liveable.
Population creates size. Planning decides what that size will become.
And with two-thirds of population growth through 2050 expected to happen in cities the question, for the world is no longer whether humans are becoming city people. It is what we build when billions of people increasingly call cities home.
Sources & Methodology
The main source is the United Nations Department of Economic and Social Affairs World Urbanization Prospects 2025 (WUP 2025). The 2025 update introduced the Degree of Urbanization (DEGURBA) method created to make city comparisons more consistent, between countries. The UNs downloadable data specifically shows the 100 cities sorted by the number of people living there and yearly estimates or predictions.
The 2025 United Nations method is very important because regular “city population” numbers can change a lot depending on if someone uses borders, larger metropolitan regions or areas that are built up continuously. For instance using the consistent method Jakarta has about 42 million people while the old way of measuring in each country gave a much lower number.
For the table:
Index value = predicted number of people living in the city or urban area in the middle of the year 2025.
The order is therefore:
Highest people → least people
Subscribe to our $1 newsletter to get new Data and Maps from around the world on various different topics every month. Click here now to join.