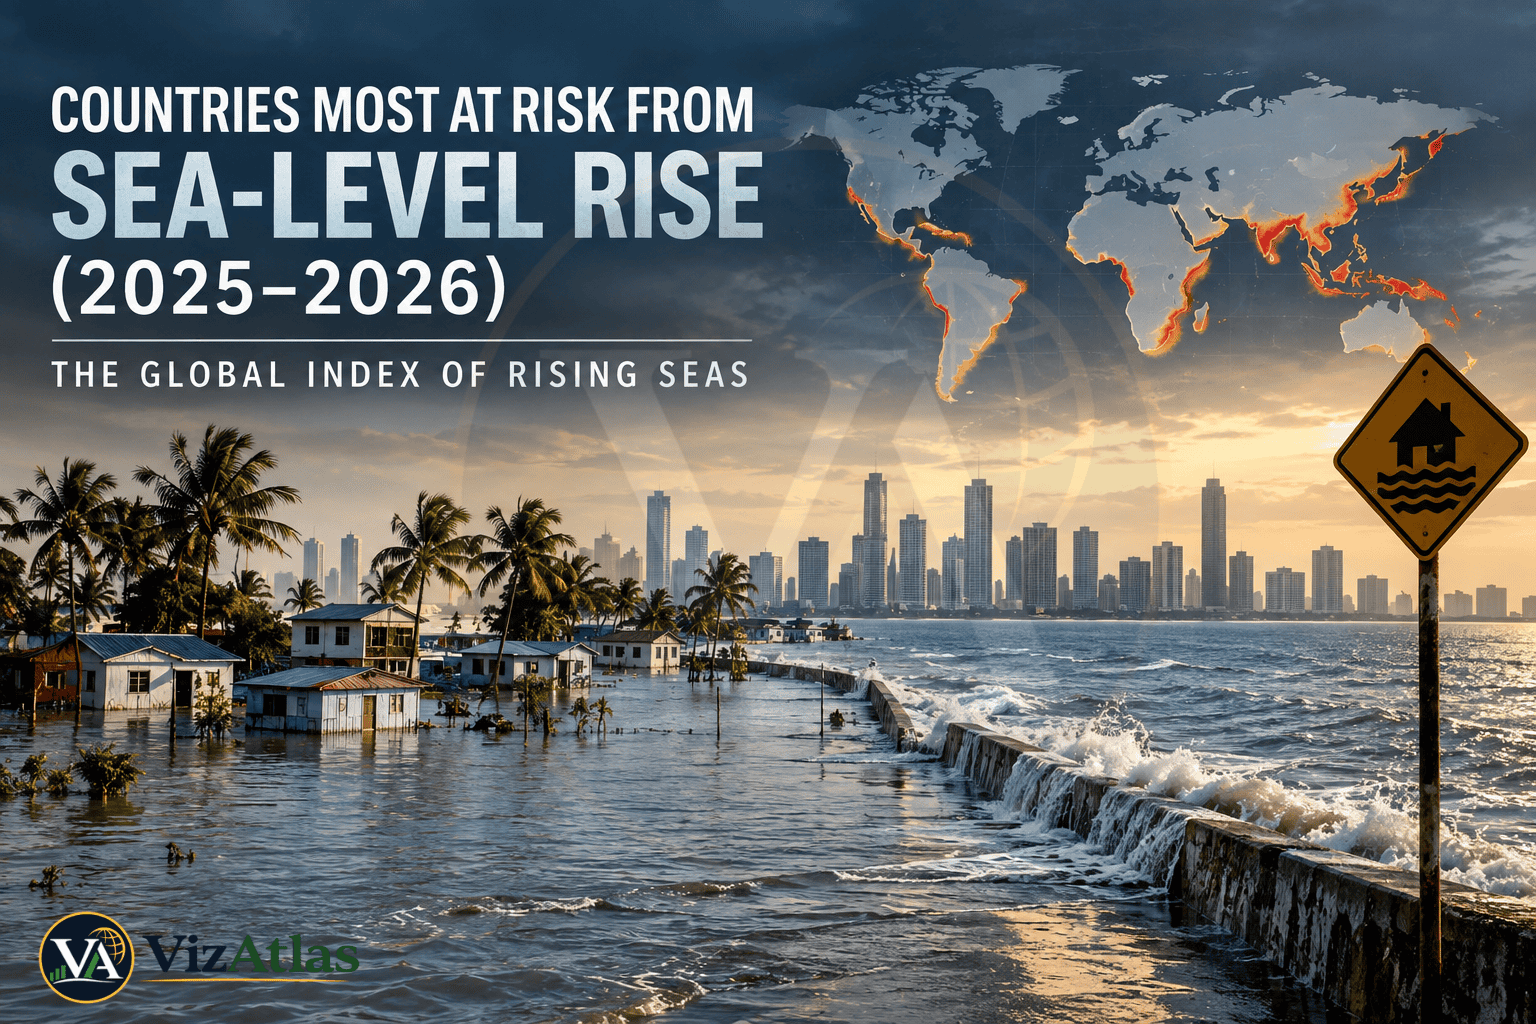
Countries Most at Risk From Sea-Level Rise (2025–2026): The Global Index of Rising Seas
A few millimetres of ocean rise may seem small. Ocean rise can still change a map.
Yet the world’s oceans do not need to rise by metres to cause big trouble. A few centimetres can turn a coastal flood into a regular one. A higher baseline lets storm surges travel inland. Saltwater can seep into freshwater systems. Roads, airports and ports built on coastal land can become hard to protect.. In the lowest island nations the difference between “land” and “sea” can be measured in metres.
That is the mathematics of sea‑level rise.
The global mean sea level reached another record in 2024 while the rate of sea‑level rise during 2015‑2024 was than twice the rate recorded during the first decade of the satellite era. By 2025 the global mean remained close to that record level with the World Meteorological Organization reporting a rise of 4.75 millimetres per year between 2012 and 2025 compared with 2.65 millimetres per year, between 1993 and 2011.
That acceleration matters because coastal risk is not linear.
When the ocean rises the water does not just cover a little land. It shifts the baseline. Every high tide every storm surge every extreme coastal event now starts from a point. The starting line moves.
That’s where the global map becomes fascinating.
The countries at risk from rising seas are not always the ones with the longest coastlines. They are not always the ones with the populations either. Some of the world’s economies have huge exposure in dollar terms.. Small island nations can face a far greater threat relative to their size their people, their economy.
One country might have millions of people living close to the coast. Still have the money and the tools to build seawalls lift buildings and redesign cities.
Another country might have tens of thousands of people—but nearly all of them live on islands just a few meters above sea level.
So the risk isn’t, about how much water is coming in. It’s about who’s there what they have and how much they can do.
The result is a risk hierarchy that changes completely depending on how you measure it. Are we counting people? Land? Economic loss? Physical exposure? National ability to adapt? Each way of looking at it gives a picture.
This VizAtlas analysis brings together those dimensions to create a Sea-Level Rise Risk Index for 2025–2026. The index is a measure that shows how severely countries may experience the consequences of rising seas.
The index is not an official United Nations ranking nor an IPCC ranking. It is a VizAtlas composite that aims to make a complicated global phenomenon easier to compare.
And the important finding, from the index is surprisingly simple:
The countries facing the greatest existential risk are not necessarily the same countries that contain the greatest number of threatened people.
The two maps tell stories.
The VizAtlas Sea-Level Rise Risk Index 2025–2026
The VizAtlas Sea‑Level Rise Risk Index evaluates countries according to five dimensions:
- Low‑elevation and physical exposure
- Population exposure
- Projected coastal flooding and land loss
- Economic vulnerability
- Adaptive capacity and resilience
The VizAtlas Sea‑Level Rise Risk Index score runs from 0 to 100, where a higher score means a greater overall risk.
Because global coastal data sets do not use the definitions, years or methods the VizAtlas Sea‑Level Rise Risk Index ranking should be read as a comparison of risk not as a precise measure of how many metres each country will lose.
The central science behind the VizAtlas Sea‑Level Rise Risk Index comes from the IPCC, the World Meteorological Organization, the World Bank, NASA Climate Central and recent peer‑reviewed studies including a 2025 Scientific Reports paper, about Asia and the Pacific and a 2026 Nature paper that looks at how coastal hazard studies may underestimate exposure.s assessment of Asia and the Pacific and a 2026 Nature study examining how coastal hazard assessments may underestimate exposure.
| Rank | Country | Value |
|---|---|---|
| 1 | Tuvalu | 94.8 |
| 2 | Marshall Islands | 92.7 |
| 3 | Kiribati | 91.8 |
| 4 | Micronesia | 89.9 |
| 5 | Maldives | 88.7 |
| 6 | Nauru | 86.9 |
| 7 | Tonga | 84.6 |
| 8 | Solomon Islands | 83.9 |
| 9 | Vanuatu | 82.8 |
| 10 | Palau | 81.6 |
| 11 | Bahamas | 80.9 |
| 12 | Bangladesh | 79.8 |
| 13 | Guyana | 78.6 |
| 14 | Vietnam | 77.9 |
| 15 | Philippines | 76.8 |
| 16 | Fiji | 75.9 |
| 17 | Cambodia | 74.8 |
| 18 | Papua New Guinea | 73.9 |
| 19 | Samoa | 72.8 |
| 20 | Indonesia | 71.9 |
| 21 | Thailand | 70.7 |
| 22 | Myanmar | 69.8 |
| 23 | Netherlands | 68.9 |
| 24 | Suriname | 68.2 |
| 25 | Mauritius | 67.5 |
| 26 | Brunei | 66.8 |
| 27 | Malaysia | 65.9 |
| 28 | Seychelles | 64.8 |
| 29 | Belize | 63.9 |
| 30 | Trinidad and Tobago | 63.1 |
| 31 | Gambia | 62.7 |
| 32 | Senegal | 61.8 |
| 33 | Egypt | 60.9 |
| 34 | Mozambique | 60.1 |
| 35 | Nigeria | 59.4 |
| 36 | Guinea-Bissau | 58.8 |
| 37 | Sierra Leone | 58.1 |
| 38 | Liberia | 57.4 |
| 39 | Guinea | 56.7 |
| 40 | Côte d’Ivoire | 55.9 |
| 41 | Benin | 55.2 |
| 42 | Togo | 54.6 |
| 43 | Cameroon | 53.8 |
| 44 | Equatorial Guinea | 53.1 |
| 45 | Gabon | 52.5 |
| 46 | Tanzania | 51.8 |
| 47 | Angola | 51.1 |
| 48 | South Africa | 50.5 |
| 49 | Madagascar | 49.9 |
| 50 | Comoros | 49.3 |
| 51 | Djibouti | 48.7 |
| 52 | Kenya | 48.1 |
| 53 | Somalia | 47.5 |
| 54 | Sudan | 46.9 |
| 55 | Libya | 46.3 |
| 56 | Tunisia | 45.7 |
| 57 | Algeria | 45.1 |
| 58 | Morocco | 44.6 |
| 59 | India | 43.9 |
| 60 | China | 43.3 |
| 61 | Japan | 42.8 |
| 62 | South Korea | 42.2 |
| 63 | Taiwan | 41.7 |
| 64 | North Korea | 41.1 |
| 65 | Pakistan | 40.6 |
| 66 | Sri Lanka | 40.1 |
| 67 | Oman | 39.6 |
| 68 | Iraq | 39.0 |
| 69 | Iran | 38.5 |
| 70 | Qatar | 38.0 |
| 71 | Bahrain | 37.5 |
| 72 | United Arab Emirates | 37.0 |
| 73 | Kuwait | 36.5 |
| 74 | Saudi Arabia | 36.0 |
| 75 | Yemen | 35.5 |
| 76 | Israel | 35.0 |
| 77 | Lebanon | 34.5 |
| 78 | Syria | 34.0 |
| 79 | Turkey | 33.5 |
| 80 | Georgia | 33.0 |
| 81 | Ukraine | 32.5 |
| 82 | Russia | 32.0 |
| 83 | Romania | 31.5 |
| 84 | Bulgaria | 31.0 |
| 85 | Greece | 30.5 |
| 86 | Albania | 30.0 |
| 87 | Montenegro | 29.5 |
| 88 | Croatia | 29.0 |
| 89 | Slovenia | 28.5 |
| 90 | Italy | 28.0 |
| 91 | Spain | 27.5 |
| 92 | Portugal | 27.0 |
| 93 | France | 26.5 |
| 94 | Belgium | 26.0 |
| 95 | Germany | 25.5 |
| 96 | Denmark | 25.0 |
| 97 | United Kingdom | 24.5 |
| 98 | Ireland | 24.0 |
| 99 | Iceland | 23.5 |
| 100 | Norway | 23.0 |
| 101 | Sweden | 22.5 |
| 102 | Finland | 22.0 |
| 103 | Estonia | 21.5 |
| 104 | Latvia | 21.0 |
| 105 | Lithuania | 20.5 |
| 106 | Poland | 20.0 |
| 107 | Canada | 19.5 |
| 108 | United States | 19.0 |
| 109 | Mexico | 18.5 |
| 110 | Guatemala | 18.0 |
| 111 | Honduras | 17.5 |
| 112 | Nicaragua | 17.0 |
| 113 | Costa Rica | 16.5 |
| 114 | Panama | 16.0 |
| 115 | Colombia | 15.5 |
| 116 | Ecuador | 15.0 |
| 117 | Peru | 14.5 |
| 118 | Chile | 14.0 |
| 119 | Argentina | 13.5 |
| 120 | Uruguay | 13.0 |
| 121 | Brazil | 12.5 |
| 122 | Venezuela | 12.0 |
| 123 | Guyana | 11.5 |
| 124 | Paraguay | 11.0 |
| 125 | Bolivia | 10.5 |
| 126 | Kazakhstan | 10.0 |
| 127 | Uzbekistan | 9.5 |
| 128 | Turkmenistan | 9.0 |
| 129 | Kyrgyzstan | 8.5 |
| 130 | Tajikistan | 8.0 |
| 131 | Afghanistan | 7.5 |
| 132 | Nepal | 7.0 |
| 133 | Bhutan | 6.5 |
| 134 | Mongolia | 6.0 |
| 135 | Armenia | 5.5 |
| 136 | Azerbaijan | 5.0 |
| 137 | Belarus | 4.5 |
| 138 | Moldova | 4.0 |
| 139 | Serbia | 3.5 |
| 140 | Hungary | 3.0 |
| 141 | Slovakia | 2.5 |
| 142 | Czechia | 2.0 |
| 143 | Austria | 1.5 |
| 144 | Switzerland | 1.0 |
| 145 | Luxembourg | 0.5 |
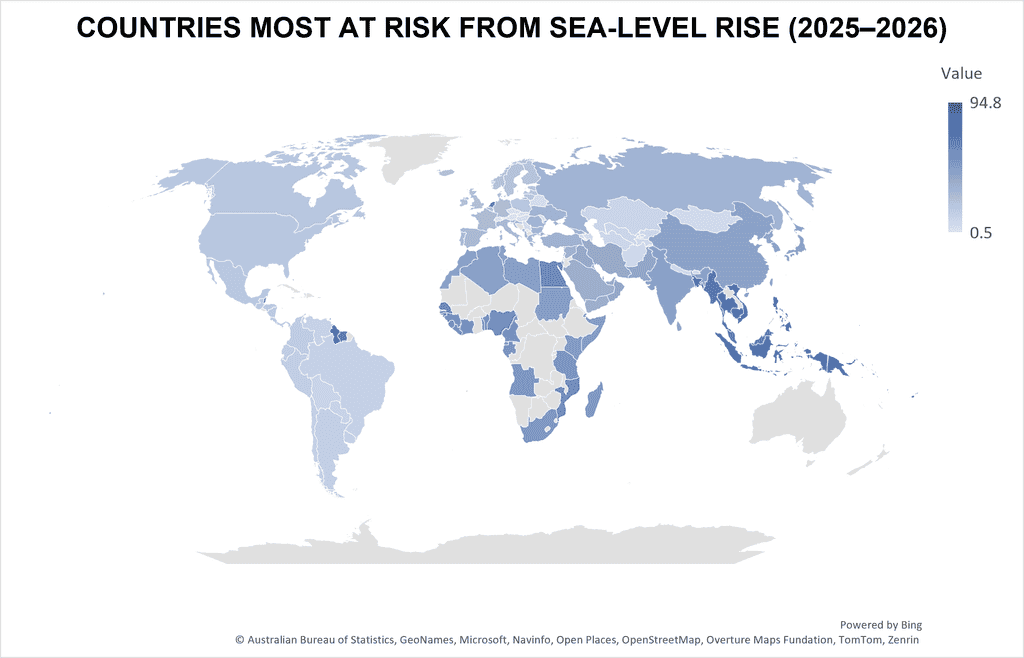
VizAtlas composite ranking shows that the scores are comparative than an official international climate index.
The table immediately reveals something
There is no definition of “most at risk.”
The Maldives is not China.
Tuvalu is not Bangladesh.
Bangladesh is not the Netherlands.
China is not Kiribati.
All can be severely affected by rising seas—each, for different reasons.
What Does “Risk From Sea-Level Rise” Mean?
Sea-level rise is often talked about as if the main question is just: “How many metres will the ocean rise?”.
That’s only the start. The real risk a country faces depends on what’s under the rising water. It’s not about depth. It’s about who lives how valuable the buildings and land are, how fast the ground is sinking or rising how often storms hit and how much protection can actually be built.
A good way to understand risk is:
Hazard × Exposure × Vulnerability = Risk
The hazard is the rising ocean. Exposure is what’s in the path of that rise—cities, homes, roads, farms. Vulnerability is how badly people, nature and property are hurt when the water comes. The more a place is vulnerable, the higher the risk.
Adaptation can lower the final impact. This difference matters a lot.
A one-metre rise in sea level doesn’t mean every country loses one metre of shoreline. It also doesn’t mean everything that’s one metre above sea level suddenly goes underwater. Things, like seawalls, natural barriers, cliffs, sand dunes, mangroves, reefs and good drainage systems can make a difference. They can protect land and people. Still the hazard is still there. The ocean is rising.. That change doesn’t go away.
The Ocean Is Rising Faster Than It Used To
The long-term trend is clear.
The WMO reports that global mean sea level reached a record high in the satellite record in 2024. Importantly the rate of rise has increased a lot. Between 1993 and 2002 global mean sea level went up by 2.1 mm each year. Between 2015 and 2024 the increase was 4.7 mm each year.
The latest WMO assessment shows that the increase has kept going in the time. Between 2012 and 2025 global sea level went up by 4.75 mm each year.
The difference between two and five millimeters might seem small.
Over one year it is.
Over years it is not.
Sea level is adding up change over time. Every extra centimeter makes it higher, for future storm surges and extreme tides.
Why Is the Sea Rising?
There are two physical reasons behind the rising sea levels.
- The ocean is getting warmer
Water expands when it gets warm. Cold water takes up space than warm water. As the Earth’s climate warms the ocean takes in a lot of heat. This causes the water to expand. So the ocean grows bigger without adding more water. This is called expansion.
- Land ice is melting
Glaciers and ice sheets are losing ice. That melted ice flows into the ocean. The big ice sheets, in Greenland and Antarctica are especially important. They hold much ice that if they melt completely sea levels could rise by several meters.
The World Meteorological Organization’s 2025 report said ocean heat levels reached a record high. It also said glaciers are losing mass at a fast rate and the loss is still going on.
These two changes happen over periods. But the end result is the same: the sea is rising.. Because the sea is rising it moves higher compared to many parts of the world’s coastlines.
How much could sea level rise by 2100?
That depends on what we do about climate change.
The IPCC’s Sixth Assessment Report gives us projections based on climate scenarios. These are ways of imagining emissions and global warming. The report says that compared to the average from 1995 to 2014 global mean sea level will likely rise by:
- 0.28 to 0.55 metres under SSP1-1.9
- 0.32 to 0.62 metres under SSP1-2.6
- 0.44 to 0.76 metres under SSP2-4.5
- 0.63 to 1.01 metres under SSP5-8.5
These numbers are considered “likely” because the science behind them has at medium confidence.
By 2050 the differences between scenarios are smaller. We could see a rise of around 0.15 to 0.23 metres under SSP1-1.9 and 0.20 to 0.29 metres under SSP5-8.5.
This is where things get tricky. Even if we act fast and cut emissions hard sea level rise is already set in motion. The oceans have warmed. Ice is melting. Water is expanding. All of this means some rise is now unavoidable.
Here’s the paradox.
Now the difference between high-emission and low-emission futures may seem small.. As time goes on that gap grows. By 2150 the differences become dramatic.
Under SSP1-1.9 the likely rise is 0.37 to 0.86 metres. Under SSP5-8.5 it could be 0.98 to 1.88 metres.
There’s more. We don’t fully understand how ice sheets in Greenland and Antarctica will react. Some models suggest they might collapse faster than expected. That means sea-level rise could be far higher, than these ranges.
The IPCC says such a high-impact outcome is unlikely.. Not impossible.
So the message is clear. Sea level rise is not one number. It’s a range of possibilities. Which future we get depends on choices we make today. Every ton of carbon matters. Every action counts.
Conclusion
The countries that rank highest on the VizAtlas index can be divided into three groups.
The Atoll Frontline: Maldives, Tuvalu, Marshall Islands, Kiribati.
The Atoll Frontlines defining problem is space. The Atoll Frontline has little elevation and limited room for retreat.
The Delta Frontline: Bangladesh, Vietnam, Guyana, Cambodia, Thailand.
The Delta Frontlines defining problem is the interaction of elevation, dense settlement, flooding, subsidence and economic dependence, on vulnerable landscapes.
The Coastal Giant Frontline: China, India, Indonesia, Philippines.
The Coastal Giant Frontlines defining problem is scale.
When national adaptive capacity is greater the Coastal Giant Frontline still faces risk because enormous populations, cities, ports and economic assets are concentrated near vulnerable coasts.
The three groups require solutions. There is no sea-level rise policy.
That distinction may be the most important conclusion in this entire analysis.
The Maldives does not need the plan as Bangladesh. Bangladesh does not need the plan as China. China does not need the plan, as Tuvalu.
The Maldives needs to protect limited land that can be lived on while keeping freshwater and reef systems safe. Bangladesh needs river mouth area, drainage, dike, farming and city strength. China needs to manage coastal financial risk while keeping protection constantly better. Tuvalu needs a mix of protection, adaptation, long-term moving plans and international help.
The risk is global. The solutions must be local.
Subscribe to our $1 newsletter to get new Data and Maps from around the world on various different topics every month. Click here now to join.