Cleanest Countries (2025–2026): What the VizAtlas Clean Country Index Reveals About Environmental Performance
Cleanliness is something we often think we understand until we try to measure it. I have seen how our assumptions can change when we look deeper.
A clean street is easy to spot. A clear river is easy to enjoy. Blue skies, waste collection and well‑maintained public spaces all give an instant sense of environmental quality.
What happens to wastewater after it disappears down a drain? Where does household waste go after it is collected? How much particulate pollution is in the air? How well are ecosystems protected? How well does infrastructure handle the growth of cities?. Most importantly can these systems keep working well year after year?
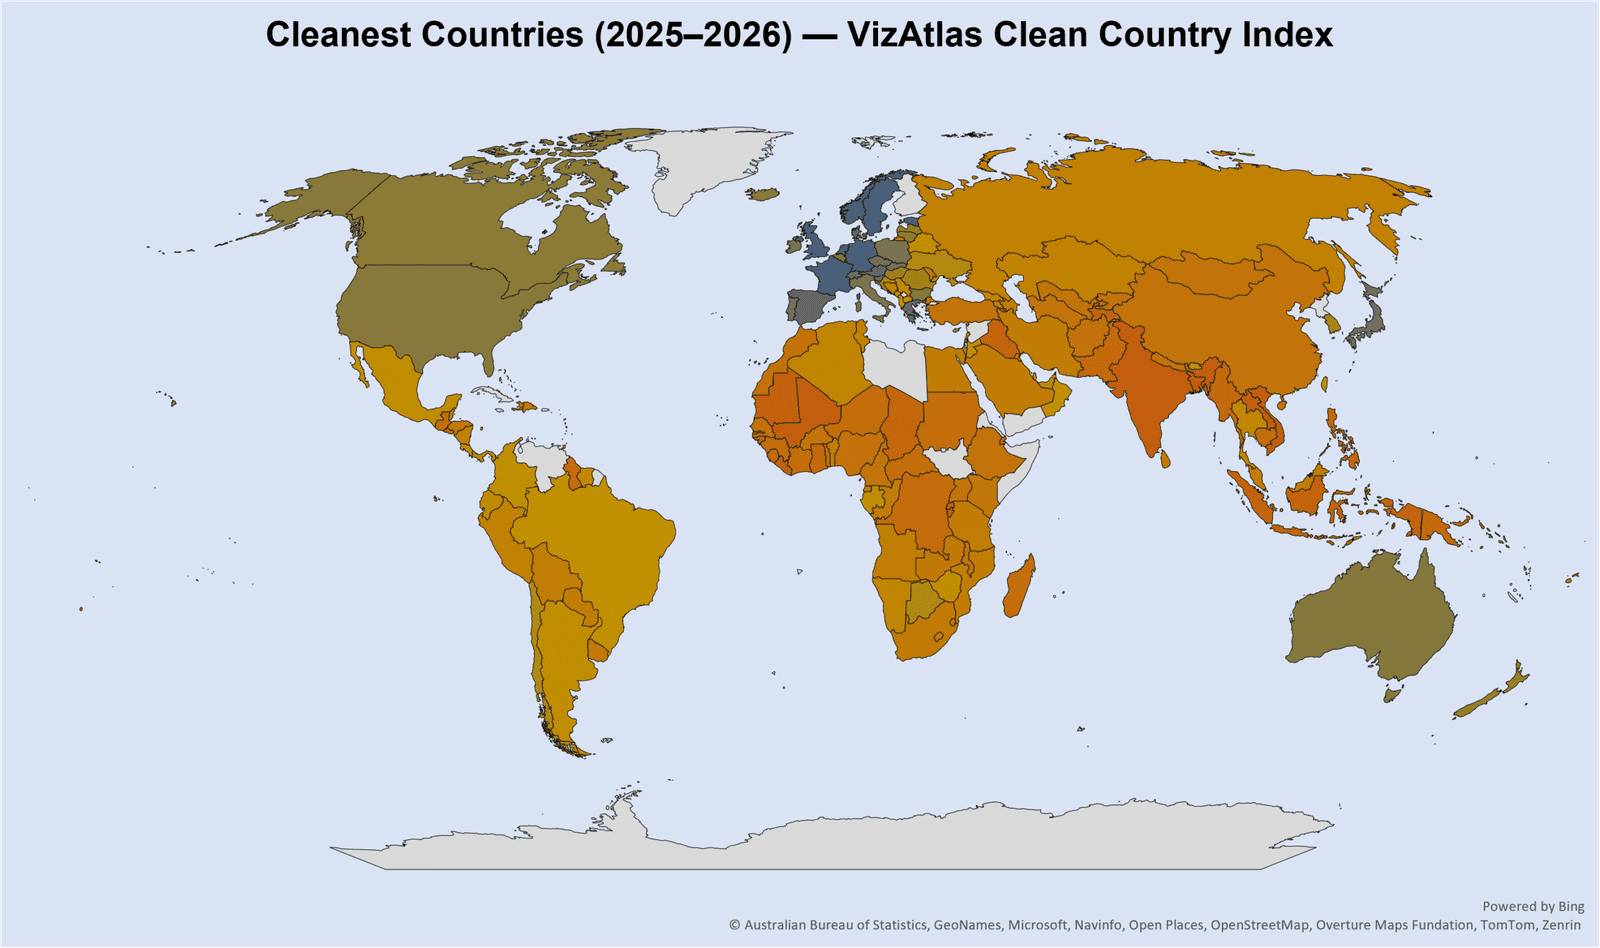
The VizAtlas’s Clean Country Index 2025–2026 treats cleanliness as an environmental‑performance idea, not just a way to judge how neat a place looks. The global map that comes with it shows a world where environmental performance’s very uneven with some regions doing better and others showing much mixed results.
That makes the index more interesting, than a list of the cleanest countries.
It is really a snapshot of how different societies handle the effects of modern life.. That difference matters.
What Does “Cleanest Country” Actually Mean?
There is no one measurement known as “country cleanliness.”
Instead environmental cleanliness comes from a group of related results. Air pollution, the quality of drinking water, sanitation, handling of waste treatment of wastewater, environmental rules, protection of ecosystems and controlling pollution all play a role in the picture.
This is why a Attractive landscape does not always mean good environmental performance.
A country can have forests and beautiful coasts but still have problems with collecting waste or treating wastewater. Another country might not have natural area but could have modern systems that keep cities very clean.
The difference is, between environmental assets and environmental management.
The first part is mostly given by the geography. The second part is built through systems organizations, rules, technology, money and the way people act.
International environmental rankings show this complexity. The Yale and Columbia 2024 Environmental Performance Index for example looks at 180 countries using 58 measures across 11 topics grouped into health the health of ecosystems and climate change.
The VizAtlas’s Clean Country Index should then be seen in the way: as a way to compare how clean and how well countries perform environmentally not as a statement that one place has perfectly clean streets and another does not.
The Numbers Behind the VizAtlas Clean Country Index
| Rank | Country | Cleanliness Index Value |
|---|---|---|
| 1 | Estonia | 74.8 |
| 2 | Luxembourg | 74.2 |
| 3 | United Kingdom | 71.5 |
| 4 | Finland | 71.0 |
| 5 | Netherlands | 70.5 |
| 6 | Germany | 69.9 |
| 7 | France | 69.8 |
| 8 | Norway | 69.2 |
| 9 | Sweden | 69.2 |
| 10 | Austria | 66.8 |
| 11 | Denmark | 66.6 |
| 12 | Spain | 66.3 |
| 13 | Greece | 66.0 |
| 14 | Slovenia | 65.0 |
| 15 | Switzerland | 64.1 |
| 16 | Japan | 63.2 |
| 17 | Czechia | 62.9 |
| 18 | Portugal | 62.7 |
| 19 | Slovakia | 62.4 |
| 20 | Ireland | 62.0 |
| 21 | Poland | 61.8 |
| 22 | Italy | 61.6 |
| 23 | Belgium | 60.1 |
| 24 | Bulgaria | 59.8 |
| 25 | Australia | 59.4 |
| 26 | Malta | 59.1 |
| 27 | United States | 58.5 |
| 28 | Iceland | 58.4 |
| 29 | Canada | 57.8 |
| 30 | Lithuania | 56.8 |
| 31 | Latvia | 55.5 |
| 32 | New Zealand | 55.5 |
| 33 | Hungary | 54.8 |
| 34 | Romania | 53.9 |
| 35 | Cyprus | 53.3 |
| 36 | Croatia | 52.8 |
| 37 | South Korea | 52.7 |
| 38 | Botswana | 51.8 |
| 39 | Israel | 51.7 |
| 40 | Ukraine | 51.1 |
| 41 | Chile | 51.0 |
| 42 | United Arab Emirates | 50.2 |
| 43 | Seychelles | 50.0 |
| 44 | Palau | 49.5 |
| 45 | Costa Rica | 49.3 |
| 46 | Albania | 49.2 |
| 47 | Gabon | 48.8 |
| 48 | Colombia | 48.8 |
| 49 | Oman | 48.5 |
| 50 | Brazil | 48.3 |
| 51 | Antigua and Barbuda | 48.0 |
| 52 | Bhutan | 47.7 |
| 53 | Belarus | 47.0 |
| 54 | Jordan | 46.7 |
| 55 | Montenegro | 46.4 |
| 56 | North Macedonia | 46.2 |
| 57 | Saint Vincent and the Grenadines | 46.1 |
| 58 | Mexico | 46.1 |
| 59 | Zimbabwe | 46.1 |
| 60 | Argentina | 46.1 |
| 61 | Dominica | 46.1 |
| 62 | Singapore | 46.1 |
| 63 | Taiwan | 46.0 |
| 64 | Trinidad and Tobago | 45.9 |
| 65 | Ecuador | 45.5 |
| 66 | Panama | 45.1 |
| 67 | Qatar | 45.1 |
| 68 | Bahamas | 45.0 |
| 69 | Serbia | 44.9 |
| 70 | Saint Kitts and Nevis | 44.6 |
| 71 | Suriname | 44.5 |
| 72 | Saint Lucia | 44.5 |
| 73 | Jamaica | 44.1 |
| 74 | Thailand | 43.7 |
| 75 | Armenia | 43.1 |
| 76 | Bosnia and Herzegovina | 42.9 |
| 77 | Namibia | 42.8 |
| 78 | Algeria | 42.7 |
| 79 | Georgia | 42.7 |
| 80 | Nicaragua | 41.7 |
| 81 | Timor-Leste | 41.5 |
| 82 | Barbados | 41.4 |
| 83 | Belize | 41.4 |
| 84 | Kazakhstan | 41.3 |
| 85 | Tunisia | 41.1 |
| 86 | São Tomé and Príncipe | 41.0 |
| 87 | Peru | 41.0 |
| 88 | Mauritius | 40.9 |
| 89 | Russia | 40.7 |
| 90 | Equatorial Guinea | 40.5 |
| 91 | Benin | 39.9 |
| 92 | Azerbaijan | 39.8 |
| 93 | Lebanon | 39.7 |
| 94 | Sri Lanka | 39.6 |
| 95 | Malaysia | 39.5 |
| 96 | Angola | 39.5 |
| 97 | Samoa | 39.3 |
| 98 | Bolivia | 39.3 |
| 99 | Kuwait | 39.2 |
| 100 | Lesotho | 39.0 |
| 101 | Paraguay | 39.0 |
| 102 | Republic of the Congo | 38.9 |
| 103 | Tanzania | 38.9 |
| 104 | Mozambique | 38.8 |
| 105 | Saudi Arabia | 38.7 |
| 106 | Egypt | 38.5 |
| 107 | Iran | 38.4 |
| 108 | Dominican Republic | 38.4 |
| 109 | Moldova | 38.0 |
| 110 | Brunei | 37.7 |
| 111 | South Africa | 37.6 |
| 112 | Honduras | 37.4 |
| 113 | Zambia | 37.2 |
| 114 | Uruguay | 36.9 |
| 115 | Kiribati | 36.3 |
| 116 | Kenya | 36.1 |
| 117 | Grenada | 35.7 |
| 118 | Fiji | 35.5 |
| 119 | Burkina Faso | 35.2 |
| 120 | Cameroon | 34.9 |
| 121 | Uzbekistan | 34.8 |
| 122 | Uganda | 34.7 |
| 123 | Turkmenistan | 34.6 |
| 124 | Eswatini | 34.4 |
| 125 | Türkiye | 34.3 |
| 126 | Mongolia | 34.2 |
| 127 | Vanuatu | 34.1 |
| 128 | Nepal | 34.0 |
| 129 | China | 33.9 |
| 130 | Ethiopia | 33.9 |
| 131 | Kyrgyzstan | 33.8 |
| 132 | Comoros | 33.5 |
| 133 | Senegal | 33.3 |
| 134 | Malawi | 33.2 |
| 135 | Afghanistan | 33.1 |
| 136 | Morocco | 33.1 |
| 137 | Tonga | 33.1 |
| 138 | Nigeria | 32.9 |
| 139 | Cabo Verde | 32.8 |
| 140 | Haiti | 32.0 |
| 141 | Central African Republic | 31.5 |
| 142 | Guatemala | 31.5 |
| 143 | Sudan | 31.3 |
| 144 | Togo | 31.3 |
| 145 | Cambodia | 31.2 |
| 146 | Madagascar | 31.1 |
| 147 | Niger | 31.1 |
| 148 | Bahrain | 31.1 |
| 149 | Côte d’Ivoire | 30.9 |
| 150 | Guinea | 30.4 |
| 151 | Guyana | 30.3 |
| 152 | Gambia | 30.2 |
| 153 | Democratic Republic of the Congo | 30.0 |
| 154 | El Salvador | 29.5 |
| 155 | Sierra Leone | 29.3 |
| 156 | Solomon Islands | 29.2 |
| 157 | Pakistan | 29.0 |
| 158 | Papua New Guinea | 28.9 |
| 159 | Myanmar | 28.9 |
| 160 | Ghana | 28.6 |
| 161 | Guinea-Bissau | 28.0 |
| 162 | Philippines | 27.9 |
| 163 | Chad | 27.7 |
| 164 | Djibouti | 26.9 |
| 165 | Tajikistan | 26.8 |
| 166 | Iraq | 26.6 |
| 167 | Rwanda | 26.4 |
| 168 | Indonesia | 26.2 |
| 169 | Mauritania | 25.3 |
| 170 | Liberia | 25.3 |
| 171 | Maldives | 25.1 |
| 172 | Burundi | 24.4 |
| 173 | Vietnam | 23.8 |
| 174 | Mali | 23.6 |
| 175 | Bangladesh | 23.5 |
| 176 | India | 22.5 |
| 177 | Laos | 21.8 |
The useful feature of a composite index is that it turns a collection of complicated environmental conditions into something that can be compared.
The number itself is only the beginning.
A high score can represent a combination of clean air, effective sanitation, strong waste-management systems, better environmental governance and protection of natural resources. A lower score can reflect weaknesses in one or several of these areas.
This also means that countries with overall scores can arrive there through very different paths.
One may perform strongly because of energy and strict pollution controls. Another may benefit from low industrial intensity and population pressure. A third may have municipal infrastructure but face environmental challenges elsewhere.
The score tells us where the outcome sits. The underlying indicators explain why it sits there.
That is why composite rankings are most valuable when they are used as starting points for questions than, as final answers.
The Big Pattern: Cleanliness Is a System, Not a Single Trait
The important pattern in global environmental cleanliness is that cleanliness tends to come from systems.
Clean streets do not appear just because people are more disciplined individually. Clean streets depend on collection schedules, waste infrastructure, enforcement, urban design, public participation and financing.
Clean water does not show up simply because a country has rainfall. Clean water requires treatment facilities protected watersheds, wastewater management, monitoring and institutions capable of keeping those systems working.
Likewise clean air depends on the structure of energy production, transportation, industrial activity, urban planning and household energy use.
The World Health Organizations air-quality database shows how complex one part of the equation can be. Its 2024 database compiled measurements of PM₂.₅ PM₁₀ and nitrogen dioxide from 7,182 settlements across more, than 120 member states using data from the 2010–2022 measurement period. That is just air quality.
Once water, sanitation, waste, ecosystems and environmental management are added, the concept of cleanliness becomes much larger. The cleanest environments therefore tend to reflect a combination of infrastructure, governance, technology, public behavior and long‑term investment.
Why Air Quality Matters So Much
Among all dimensions air quality has a unique trait: people cannot choose not to breathe.
A polluted river can sometimes be avoided. A managed landfill can be isolated by geography.. Polluted air travels through neighborhoods, cities and regions.
WHO estimates that 99 percent of the world’s population lived in places in 2019 where air quality guideline levels were not met. Outdoor air pollution alone was linked to about 4.2 million deaths that year while outdoor and indoor air pollution combined were linked to, about 6.7 million premature deaths each year.
I find it hard to believe that a country’s cleanliness can be judged by what you can see.
I see that a country can have beautifully kept spaces while still carrying a large invisible pollution burden.
I also see that a place can have infrastructure yet have strong environmental outcomes because of geography, low industrial intensity, cleaner energy systems or good regulation.
The lesson is clear: appearance is not a measurement.
Water and Sanitation: The Invisible Infrastructure
If air is the resource people use every second, water and sanitation form one of the most important pieces of invisible infrastructure that supports everyday life.
A modern sanitation system does more than get rid of waste. It stops pollution, keeps groundwater and waterways safe lowers the chance of getting sick from germs and helps keep people healthy. The same idea applies to drinking water.
Water quality is not about where the water comes from. It is also about how it’s cleaned how it is sent out through pipes how it is checked and how it is kept in good condition. A water source that looks clean and natural does not automatically mean the water at home is safe to drink.
This is one reason environmental performance should not be mixed up with beauty.
A country can have forests, mountains, lakes or beaches while still having big problems with how it manages the environment. On the hand a place that is full of people and does not have a lot of wild areas can still have good cleanliness because of good systems and tools.
Waste: The Test of a Modern Society
Nothing shows how good environmental management is clearly as waste. Every city makes waste. The real question is what happens after that.
Collecting, sorting, recycling breaking down handling, managing landfills and dealing with waste all decide if the things people throw away become something useful or a problem for the environment.
UNEPs environmental reports keep saying that clean air, clean water, using resources efficiently, making cities sustainable and handling waste better are all parts of a healthy environment.
A country that is clean does not always mean a country that makes little waste. It might mean, It is a country that is good at handling the waste it makes.
That difference matters more, as more people live in cities and as people use more things.
Why Wealth Appears in the Background
There is another pattern looking at: the connection between how well a place takes care of the environment and how much money it has.
This connection is not always clear. It still has meaning.
Building systems to clean water costs money. Having ways to move people around needs money. Checking the air quality needs machines and people who know how to use them. Sorting and reusing materials needs a way to move them around. Watching over the environment needs organizations that can do the job.
The 2024 Environmental Performance Index clearly says that money is a sign of how well a country takes care of the environment.. It also shows that some countries do a lot better than their money level suggests and others do worse than their money level suggests.
This is important because it stops people from thinking the VizAtlas ranking is simple. A high score, for cleanliness should not be seen as because of money. Money gives chances. The way a place organizes itself decides how many of those chances are used.
Notable Finding: Cleanliness and Environmental Quality Are Not the Same
One of the mistakes when reading the phrase “cleanest countries” is to think that Cleanliness means the same, as Environmental Quality.
Cleanliness and Environmental Quality do overlap but Cleanliness and Environmental Quality are not identical.
Street Cleanliness can be seen.
Air Quality is mostly invisible.
Waste Collection can be seen.
Groundwater Contamination may not be seen.
A Protected Forest can be seen from above.
The Ecological Health of soil, waterways and species can be much harder to see.
A national Environmental Index tries to connect these dimensions into one analytical picture. That is useful because it creates comparability. It also means the final number inevitably compresses a complicated reality.
What the Data Does Not Tell Us
A cleanliness score cannot tell us everything about the environmental life inside a country. We see many people think this score covers everything.
Cleanliness score does not describe every city.
Cleanliness score does not describe every neighborhood.
Cleanliness score cannot capture every variation.
Cleanliness score cannot fully represent environmental inequalities.
A country can have national performance while some communities experience substantially worse air, water or waste‑management conditions than the national average. We have spoken to few residents who feel ignored.
The opposite is also possible.
A country with a modest overall score may contain individual cities, regions or ecosystems performing extremely well. National averages are useful precisely because they simplify.
Simplification is also their limitation.
The VizAtlas’s Clean Country Index should therefore be read as a macro‑level tool not as a substitute for local environmental monitoring.
The Problem With Treating Rankings as Absolute Truth
Rankings are powerful because humans like order.
Put 100 observations into a list. Suddenly a complicated subject feels easy to understand. Environmental performance rarely changes in neat ranking steps.
If two countries have scores separated by a fraction of a point the numerical difference may be less meaningful than the ranking positions suggest.
Conversely a large gap may indicate a difference in environmental capacity.
The best way to interpret a cleanliness index is therefore to look for patterns, clusters and structural differences than becoming obsessed with one position. I suggest we look beyond the spot. The map is often more informative than the leaderboard.
The Map shows where high and low performance clusters appear, where transitions occur and how environmental outcomes interact with geography and development.
Another Distinction: Clean Is Not the Same as Green
A society can have extremely efficient waste collection while consuming large quantities of resources. I have watched factories still run power.
Society can have streets but a carbon‑intensive energy system.
Society can have drinking‑water infrastructure but put significant pressure on ecosystems elsewhere through its consumption patterns.
This is why cleanliness and sustainability should not be treated as concepts. Cleanliness is largely about conditions and management.
Sustainability asks a Hard question:
Can those conditions be maintained over the long term without exhausting the natural systems that support them?
That introduces climate change, biodiversity, resource consumption and ecological footprints into the conversation.
The cleanest country today is not necessarily the country, with the sustainable environmental model tomorrow.
Conclusion: The Bigger Picture
The VizAtlas Clean Country Index gives a way to ask a question that seems simple at first about clean places.
Which countries are clean?
The deeper answer is that clean is not a trait that a country owns. It is the result of thousands of systems that work together.
Air cleanness reflects energy, transport and industry.
Water cleanness reflects sanitation, treatment and resource management.
Waste cleanness reflects consumption, collection and circularity.
Ecosystem health reflects land use, regulation and conservation.
Public cleanliness reflects systems and everyday behavior.
All of these are influenced by governance, technology, economics and geography.
That is why environmental rankings are most useful when they show patterns of just naming winners.
The global picture remains uneven. The map shows differences in environmental performance while international evidence shows that major challenges remain in air pollution, waste management, sanitation and broader ecosystem protection. WHO’s latest air-quality data continues to show how large the global pollution exposure is, while UNEPs waste outlook shows that waste worldwide is rising without prevention and management systems.
The challenge for the coming decades is not simply to make countries look cleaner. It is to make the systems underneath them cleaner.
That means energy, cleaner transport, safer water, better sanitation, smarter waste management, stronger ecosystem protection and more effective environmental governance.
The revealing part of the Cleanest Countries 2025–2026 story is ultimately not the color of a country on a map. It is what that color represents.
Behind every environmental score is an invisible network of pipes, treatment plants, collection systems, regulations, monitoring stations, public services, technologies and human decisions.
When those systems work together clean becomes almost effortless to see. When they fail the consequences eventually become impossible to hide.
And that is the lesson of the VizAtlas’s Clean Country Index: a clean environment is not simply a place without pollution. It is a society, with the capacity to prevent, manage and reduce it.
Sources
- Yale Center for Environmental Law & Policy. 2026 Environmental Performance Index (EPI). The 2026 EPI evaluates 177 countries using 47 indicators across 12 issue categories covering Environmental Health, Ecosystem Vitality and Climate Change.
- Yale EPI 2026 Scores, Trends and Ranks dataset. This is the underlying country-level dataset used for the values. Yale makes the scores, ranks, indicator scores and raw data available for download.
- Ranking Countries. Yale EPI country dataset. The complete 177-country table provides the 2026 country scores used to construct the ranking.
Methodology
For this VizAtlas Cleanliness Index 2025–2026, We use the 2026 Yale Environmental Performance Index score as the standardized cleanliness/environmental-performance value. This is preferable to inventing a score from unrelated national datasets because the EPI already combines internationally comparable environmental-health and environmental-performance indicators using a transparent methodology. The 2026 EPI contains 47 indicators, across 12 categories.
The index is therefore:
Cleanliness Index = 2026 EPI country score
Scale: 0–100
Higher value: environmental performance / cleaner overall conditions
Lower value: poorer environmental performance
Subscribe to our $1 newsletter to get new Data and Maps from around the world on various different topics every month. Click here now to join.