Internet Penetration by Country 2026: Ranking the Most Connected Countries in the World
For most of history, geography shaped how easily people could talk to one another. Distance made a difference. Borders made a difference. The kind of infrastructure in place made a difference. Mountains blocked paths. Oceans divided the world. All of that mattered.
Then the world of internet began. Slowly and quietly, it started to break down those walls. It didn’t erase geography. It changed what geography looked like.
Some countries are already fully connected. Almost everyone there has access to internet. Others are still behind—decades away from that kind of reach. In the middle? That’s where most of the world lives. A lot of people are online. A lot still aren’t.
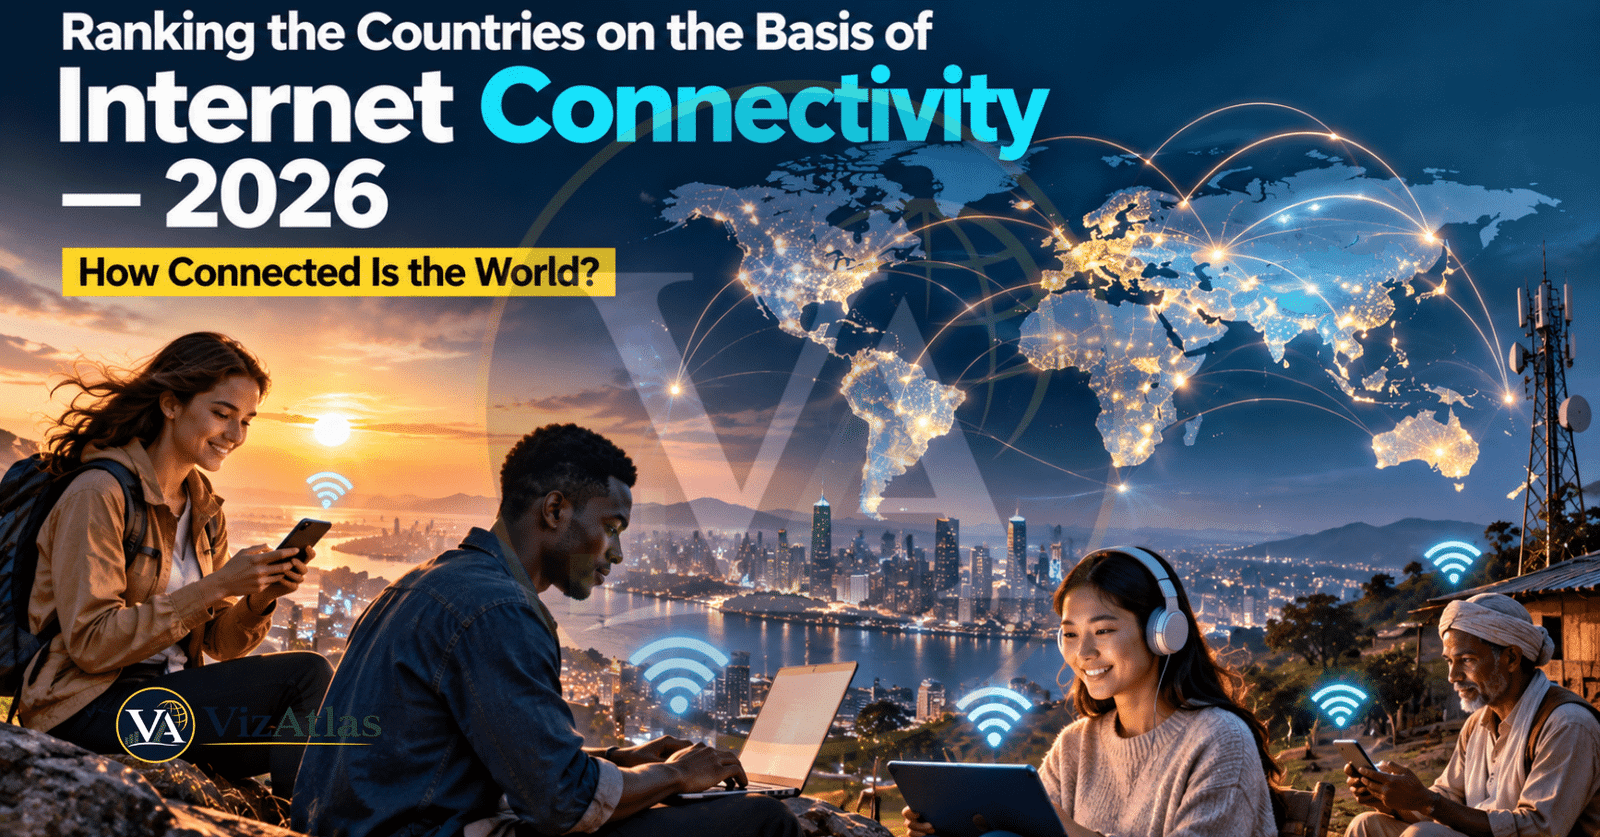
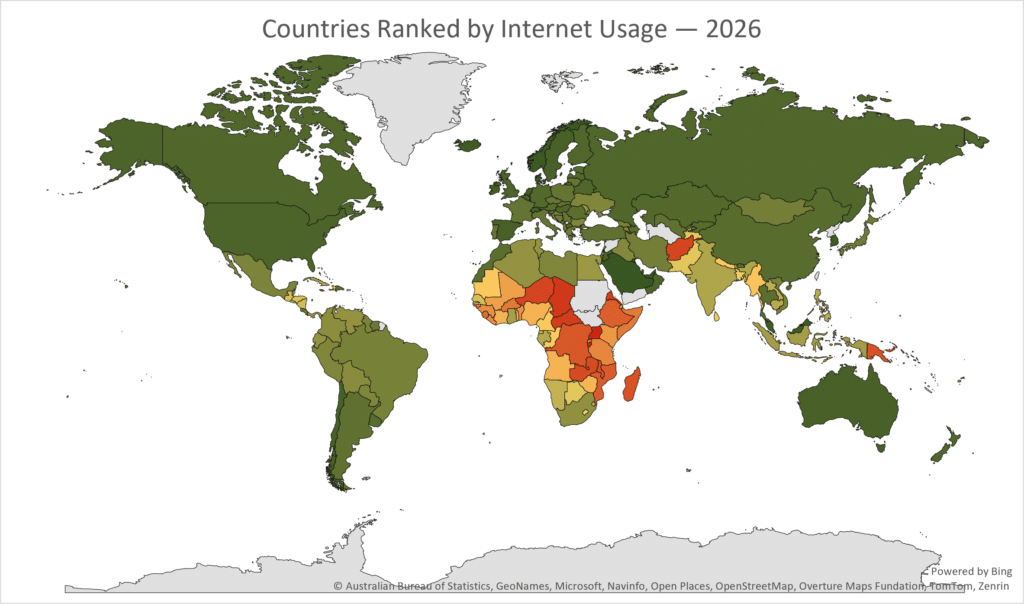
The VizAtlas Internet Connectivity Ranking 2026 shows this gap clearly. It uses one of the important numbers for digital inclusion: how many people in a country actually use the internet. The data covers 185 countries and the numbers range from 8.6% to a full 100%.
The average across all those countries is 71.81%. That sounds pretty strong.. The median is 82%. The median is higher than the average. That’s not a difference. It’s a signal. It means a lot of countries have internet usage but a few very low ones pull the average down.
That’s the story the data tells. The internet age isn’t the same for everyone. It’s uneven. It’s not one size fits all. Some places are high up the mountains while some are on the edge. Many are somewhere in between. That gap—between who is connected and who isn’t—still depends on geography even in the digital age.
What Does “Internet Connectivity” Mean?
Internet connectivity can mean things depending on the context.
It could be about whether you or your family have access to the internet. It might refer to whether your home has broadband service. It could be about whether your mobile network covers your area. It also includes how fast the connection is, how much it costs and whether people actually use the internet.
For this ranking, the definition is simpler and clearer. We are using one measure: the percentage of a country’s population that uses the internet.
This data comes from The World Bank. It is based on information gathered by the International Telecommunication Union. According to this standard, an internet user is someone who has accessed the internet from any place in the three months. That includes using computers, phones or other devices connected online.
That detail matters.
This measure does not show how fast your internet is.
It does not rank the quality of broadband.
It does not compare 5G coverage or fiber networks.
Instead it shows how widespread internet use really is—how many people, in a country are actually online. This helps us understand inclusion more clearly.
Internet Penetration by Country: Which Countries Are the Most Connected in 2026?
| Rank | Country | Internet users (% of population) |
|---|---|---|
| 1 | Bahrain | 100% |
| 2 | Denmark | 100% |
| 3 | Kuwait | 100% |
| 4 | Saudi Arabia | 100% |
| 5 | United Arab Emirates | 100% |
| 6 | Luxembourg | 99% |
| 7 | Monaco | 99% |
| 8 | Norway | 99% |
| 9 | Iceland | 98% |
| 10 | Liechtenstein | 98% |
| 11 | Malaysia | 98% |
| 12 | Qatar | 98% |
| 13 | South Korea | 98% |
| 14 | Ireland | 97% |
| 15 | Netherlands | 97% |
| 16 | San Marino | 97% |
| 17 | Switzerland | 97% |
| 18 | Australia | 96% |
| 19 | Belgium | 96% |
| 20 | Brunei | 96% |
| 21 | Chile | 96% |
| 22 | Jordan | 96% |
| 23 | Spain | 96% |
| 24 | Sweden | 96% |
| 25 | Oman | 95% |
| 26 | United Kingdom | 95% |
| 27 | United States | 95% |
| 28 | Andorra | 94% |
| 29 | Belarus | 94% |
| 30 | Canada | 94% |
| 31 | Finland | 94% |
| 32 | Hungary | 94% |
| 33 | Malta | 94% |
| 34 | New Zealand | 94% |
| 35 | Russia | 94% |
| 36 | Singapore | 94% |
| 37 | Germany | 93% |
| 38 | Kazakhstan | 93% |
| 39 | Latvia | 93% |
| 40 | North Macedonia | 93% |
| 41 | Austria | 92% |
| 42 | Bahamas | 92% |
| 43 | China | 92% |
| 44 | Estonia | 92% |
| 45 | Kyrgyzstan | 92% |
| 46 | Uruguay | 92% |
| 47 | Azerbaijan | 91% |
| 48 | Bhutan | 91% |
| 49 | Dominican Republic | 91% |
| 50 | Morocco | 91% |
| 51 | Romania | 91% |
| 52 | Slovenia | 91% |
| 53 | Thailand | 91% |
| 54 | Argentina | 90% |
| 55 | Cyprus | 90% |
| 56 | Jamaica | 90% |
| 57 | Slovakia | 90% |
| 58 | Türkiye | 90% |
| 59 | Uzbekistan | 90% |
| 60 | France | 89% |
| 61 | Italy | 89% |
| 62 | Kiribati | 89% |
| 63 | Lithuania | 89% |
| 64 | Montenegro | 89% |
| 65 | Poland | 89% |
| 66 | Czechia | 88% |
| 67 | Israel | 88% |
| 68 | Portugal | 88% |
| 69 | Serbia | 88% |
| 70 | Seychelles | 88% |
| 71 | Costa Rica | 87% |
| 72 | Palestine | 87% |
| 73 | Suriname | 87% |
| 74 | Albania | 86% |
| 75 | Bosnia and Herzegovina | 86% |
| 76 | Greece | 86% |
| 77 | Japan | 86% |
| 78 | Iran | 85% |
| 79 | Maldives | 85% |
| 80 | Mongolia | 85% |
| 81 | Brazil | 84% |
| 82 | Croatia | 84% |
| 83 | Georgia | 84% |
| 84 | Palau | 84% |
| 85 | Vietnam | 84% |
| 86 | Guyana | 83% |
| 87 | Mexico | 83% |
| 88 | Nauru | 83% |
| 89 | Bulgaria | 82% |
| 90 | Dominica | 82% |
| 91 | Libya | 82% |
| 92 | Paraguay | 82% |
| 93 | Peru | 82% |
| 94 | Trinidad and Tobago | 82% |
| 95 | Ukraine | 82% |
| 96 | Armenia | 81% |
| 97 | Iraq | 81% |
| 98 | Lebanon | 81% |
| 99 | Belize | 80% |
| 100 | Bolivia | 80% |
| 101 | Colombia | 79% |
| 102 | South Africa | 78% |
| 103 | Algeria | 77% |
| 104 | Ecuador | 77% |
| 105 | Moldova | 77% |
| 106 | Saint Kitts and Nevis | 77% |
| 107 | Tunisia | 77% |
| 108 | Venezuela | 77% |
| 109 | Saint Vincent and the Grenadines | 76% |
| 110 | Cabo Verde | 75% |
| 111 | Egypt | 75% |
| 112 | Fiji | 75% |
| 113 | Antigua and Barbuda | 73% |
| 114 | Indonesia | 73% |
| 115 | Mauritius | 73% |
| 116 | Panama | 73% |
| 117 | Ghana | 72% |
| 118 | Barbados | 70% |
| 119 | Cuba | 70% |
| 120 | Grenada | 70% |
| 121 | India | 70% |
| 122 | Gabon | 69% |
| 123 | Cambodia | 68% |
| 124 | Saint Lucia | 68% |
| 125 | Tonga | 67% |
| 126 | Philippines | 67% |
| 127 | El Salvador | 66% |
| 128 | Laos | 66% |
| 129 | Marshall Islands | 66% |
| 130 | Djibouti | 65% |
| 131 | Namibia | 65% |
| 132 | Eswatini | 63% |
| 133 | Equatorial Guinea | 63% |
| 134 | Nicaragua | 61% |
| 135 | Guatemala | 60% |
| 136 | Senegal | 60% |
| 137 | São Tomé and Príncipe | 59% |
| 138 | Honduras | 59% |
| 139 | Botswana | 57% |
| 140 | Pakistan | 57% |
| 141 | Tajikistan | 56% |
| 142 | Sri Lanka | 55% |
| 143 | Bangladesh | 53% |
| 144 | Lesotho | 52% |
| 145 | Gambia | 49% |
| 146 | Haiti | 48% |
| 147 | Republic of the Congo | 47% |
| 148 | Cameroon | 46% |
| 149 | Mauritania | 46% |
| 150 | Nepal | 46% |
| 151 | Myanmar | 45% |
| 152 | Zimbabwe | 42% |
| 153 | Angola | 41% |
| 154 | Côte d’Ivoire | 41% |
| 155 | Nigeria | 41% |
| 156 | Micronesia | 40% |
| 157 | Togo | 39% |
| 158 | Mali | 37% |
| 159 | Timor-Leste | 35% |
| 160 | Kenya | 35% |
| 161 | Benin | 34% |
| 162 | Guinea | 33% |
| 163 | Comoros | 33% |
| 164 | Liberia | 32% |
| 165 | Rwanda | 32% |
| 166 | Tanzania | 31% |
| 167 | Guinea-Bissau | 30% |
| 168 | Solomon Islands | 29% |
| 169 | Burkina Faso | 28% |
| 170 | Somalia | 28% |
| 171 | Sierra Leone | 25% |
| 172 | Ethiopia | 22% |
| 173 | Mozambique | 21% |
| 174 | Democratic Republic of the Congo | 20% |
| 175 | Madagascar | 19% |
| 176 | Malawi | 19% |
| 177 | Papua New Guinea | 19% |
| 178 | Zambia | 17% |
| 179 | Afghanistan | 16% |
| 180 | Niger | 16% |
| 181 | Eritrea | 14% |
| 182 | Central African Republic | 14% |
| 183 | Chad | 13% |
| 184 | Uganda | 8.9% |
| 185 | Burundi | 8.6% |
Connectivity Has Become a Development Indicator
The rise of the Internet is becoming more and more connected with development trends.
According to the ITU, the link between Internet use and economic development is also strong. 94 per cent of the population in high income countries used the Internet in 2025 compared to 23 per cent of the population in low income countries.
That is a huge gap. It reminds us that communications are not just about putting wires into the ground.
People need devices.
They need electricity.
They need data.
They need skills.
They need services worth connecting to.
The more things we can do on the Internet, Our education, banking, jobs, healthcare, government and shopping, The more useful the Internet will be. The effect then works like this: usable digital services lead to adoption and a larger group of users, encourages the development of more digital services.
The Rural–Urban Divide Is Still Huge
National averages can also hide another important part of connectivity: where you actually live.
In 2025, 85% of people in urban areas around the world had internet access while only 58% of those in rural areas did, according to the ITU’s estimates.
That’s a gap of 27 percentage points. This difference matters a lot.
Some countries might look good on paper with a national internet use rate yet still have parts of the country where people lack reliable internet.
So even if a country ranks high in internet access it doesn’t mean every single person in that country has the same level of internet connection.
The Gender Gap Has Not Disappeared
Internet connectivity also has a gender dimension. How people connect to the internet often depends on their gender as well.
The International Telecommunication Union (ITU) predicted that by 2025, 77 percent of men and 71 percent of women would be on the internet worldwide. This creates a gender gap of six percent.
The gender gap is much larger in some regions than in others. The gap varies substantially across regions.
This matters because access to the internet is becoming more and more linked to education, money, job opportunities, information and political participation.
So simply adding people online is not enough. Who is online, how well they are connected and what they can do online are questions important for digital inclusion.
Young People Are Driving the Next Wave
Age creates another difference.
In a 2025 Report, 82% of people aged 15 to 24 are online globally while 72% of the rest of the population are online. The pattern makes sense. It’s important to notice.
Younger generations have grown up with phones and digital media. They have learned to study and learn online. For them being connected is second nature.
This leads to a major shift.
More people will use the internet as new generations get older even if there are no changes in infrastructure. Still cost and accessibility will keep some people from joining.
It’s not about people choosing to use the internet. It’s about the internet becoming something we all have to figure out how to use.
Conclusion: The World Is Online — But Not Equally
The Ranking of Countries on the Ground of Internet Connectivity 2026 shows a world that is deeply connected. Also deeply divided.
At the top, internet penetration is nearly complete. The first ten countries listed have an average of 99.3%. That means these nations are almost fully online. The number of people without internet access is very small. In fact, the top ten are so close to coverage that the content gap is almost zero. For the list, the median internet penetration stands at 82%. That suggests that reaching this level is not rare. It’s within reach for many countries.
Look at the lower end. The bottom ten countries average 14.55% of internet penetration. That’s than one in seven people online. The gap between the top and the bottom stretches across 91.4 percentage points. This wide gap is the actual divide. It exists in numbers. It’s not a concept. It’s real. It’s measurable. It’s the difference between being included and being left behind.
The task of connecting everyone is not done. It’s just starting. Connecting a country is the first step. Real access means more than just turning on a dial. Meaningful digital access means services that people can afford. It means connections that don’t drop out every five minutes. It means people who know how to use the internet. It means being safe. It means having content. It means experiences that matter.
The internet began as a network for computers. Now it’s becoming a web of opportunity. For some, the internet journey is over. For others it has only just begun. Countries that have universal coverage are nearing the end of one phase. For most of the world the race is still on. The goal is to get people through the door.
The interesting part of the 2026 ranking isn’t just where countries are now. It’s where they still need to go. The future isn’t, about who is ahead. It’s about who has a chance to catch up. The world is split. One side has the tools. The other side still needs them. The divide is clear. The work remains.
Subscribe to our $1 newsletter to get new Data and Maps from around the world on various different topics every month. Click here now to join.
Sources
- International Telecommunication Union (ITU) ICT Development Index 2026- The recent edition of the ITU digital-development index covering 159 economies and intended to measure broadband internet connectivity, access and use as well as consumer literacy and skills.
- World Bank. People using the Internet (% of population). From the ITU World Telecommunication/ICT Indicators Database. Please note that the World Bank database used to source this indicator is currently available up to 2025.
- Our World in Data- Percentage of population using the Internet ITU data from World Bank (except data for 2025, where no estimate was available); last available data points for countries used when 2025 estimates are not available.
- ITU Global Connectivity Report 2025 for the concept of meaningful connectivity still including use of the Internet access to broadband, mobile service and coverage cost and quality.
Methodology
This report in this Viz Atlas Internet Connectivity Index 2026 is the appropriate global indicator that compare the data to:
The Internet Connectivity Score = % of the population in a country using the Internet.
Percentage = higher Internet connectivity.
- The recent ITU/World Bank observation for each country is used.
- A 2025 observation is included where available.
- Where data for 2025 are not available the latest recent ITU observation is kept than creating a 2026 estimate.
- Territories and dependencies are not ranked if the goal is to give a country ranking.
- Countries without recent data are omitted.
- Ranking direction: highest Internet connectivity to bottom Internet connectivity.