
Countries with the Highest Taxes 2025–2026: Global Tax Rates, Tax Burden & Rankings Explained
Taxes are among the few things that can transform a plain number into something that feels very personal.
A percentage shown in a tax table can appear harmless but when that percentage is applied to a paycheck, a business decision or an investment return, it suddenly becomes part of everyday life.
Yet saying a country has “high taxes” hides a surprisingly complex question.
High what? A top marginal income tax rate? The total amount of taxes collected by the government? The portion of a worker’s labour cost taken by taxes and social contributions? Consumption taxes? Corporate taxes? Property taxes?
Tax measurements are very different.
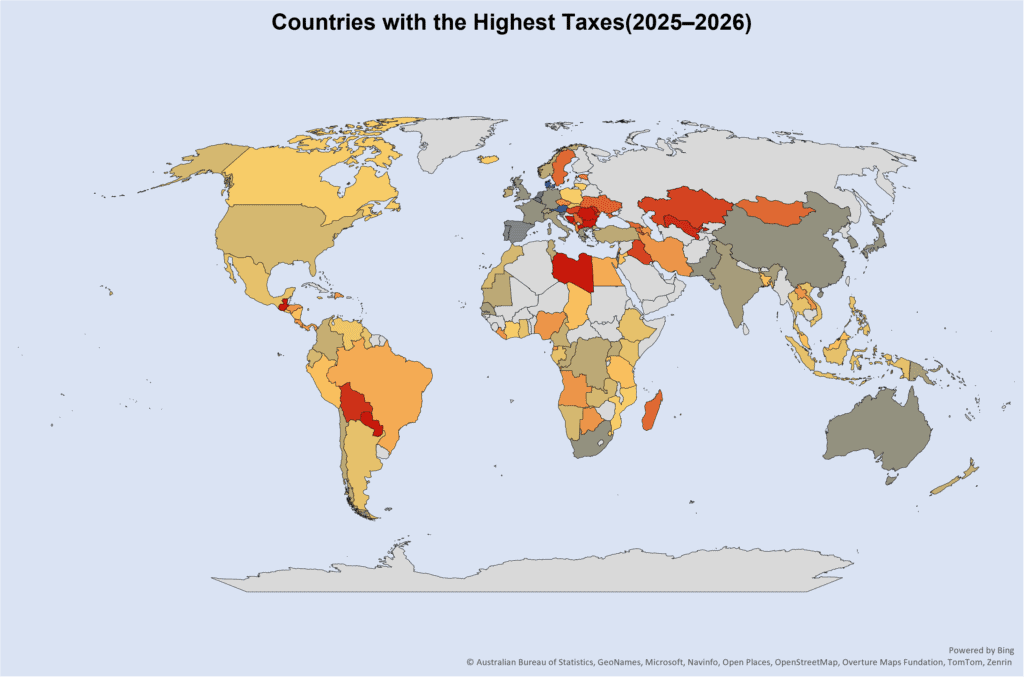
In the VizAtlas’s Countries with the Highest Taxes 2025–2026 dataset, the key measure is the Highest Taxes Index Value (%). This value ranges from 57% at the top to 7% at the bottom across 118 countries. The dataset therefore captures an important dimension of taxes: the highest personal income tax rate shown in the index.
The Highest Taxes Index Value creates a 50-percentage-point gap between the top and bottom of the ranking.
The average value for all 118 entries is 31.81% while the median is 32.50%. The upper quarter of the dataset starts around 40%. The lower quarter ends around 25%.
The result is a tax map that’s far from uniform. However the interesting story is not simply which countries sit at the top.
High taxes are what reveal how modern governments raise money, redistribute income, finance services and design incentives, around work.
What Does “Highest Taxes” Actually Mean?
The phrase ” taxes” is often used too casually.
One country might have a high top marginal personal income-tax rate but still collect a smaller share of national income in taxes compared to another country.
Another country might have a moderate income-tax rate but rely heavily on consumption taxes, payroll contributions or other types of levies.
That difference matters a lot.
The top statutory personal income-tax rate is the rate applied to the portion of taxable income once a taxpayer hits the threshold. It’s a rate, which means it only applies to the income that falls into that bracket—not to all income earned.
The OECD’s Personal Income Tax database defines the statutory rate using a single person with no dependants at the income level where the top rate first applies. It also records the income threshold and the combined marginal rate, including employee social-security contributions. That detail helps avoid one of the common mistakes when comparing tax systems.
A top marginal rate of 50% does not mean someone earning enough to reach that bracket pays half of their total income to the government.
Tax systems are built in brackets. Only the income, in the bracket is taxed at the top rate. That little word—marginal—does a lot of work.
The Numbers Behind the 2025–2026 Tax Ranking
| Rank | Country | Highest Taxes Index Value (%) |
|---|---|---|
| 1 | Denmark | 57.00 |
| 2 | Austria | 55.00 |
| 3 | Finland | 52.00 |
| 4 | Belgium | 50.00 |
| 5 | Israel | 50.00 |
| 6 | Slovenia | 50.00 |
| 7 | Netherlands | 49.50 |
| 8 | Portugal | 48.00 |
| 9 | Spain | 47.00 |
| 10 | Australia | 45.00 |
| 11 | China | 45.00 |
| 12 | France | 45.00 |
| 13 | Germany | 45.00 |
| 14 | Japan | 45.00 |
| 15 | Pakistan | 45.00 |
| 16 | South Africa | 45.00 |
| 17 | South Korea | 45.00 |
| 18 | United Kingdom | 45.00 |
| 19 | Greece | 44.00 |
| 20 | Switzerland | 43.20 |
| 21 | Italy | 43.00 |
| 22 | Senegal | 43.00 |
| 23 | India | 42.744 |
| 24 | Luxembourg | 42.00 |
| 25 | Papua New Guinea | 42.00 |
| 26 | Chile | 40.00 |
| 27 | Democratic Republic of the Congo | 40.00 |
| 28 | Ireland | 40.00 |
| 29 | Mauritania | 40.00 |
| 30 | Republic of the Congo | 40.00 |
| 31 | Tunisia | 40.00 |
| 32 | Türkiye | 40.00 |
| 33 | Uganda | 40.00 |
| 34 | Norway | 39.80 |
| 35 | Colombia | 39.00 |
| 36 | New Zealand | 39.00 |
| 37 | Cameroon | 38.50 |
| 38 | Ecuador | 37.00 |
| 39 | Morocco | 37.00 |
| 40 | Namibia | 37.00 |
| 41 | United States | 37.00 |
| 42 | Zambia | 37.00 |
| 43 | Argentina | 35.00 |
| 44 | Cyprus | 35.00 |
| 45 | Ethiopia | 35.00 |
| 46 | Gabon | 35.00 |
| 47 | Ghana | 35.00 |
| 48 | Guyana | 35.00 |
| 49 | Indonesia | 35.00 |
| 50 | Kenya | 35.00 |
| 51 | Malta | 35.00 |
| 52 | Mexico | 35.00 |
| 53 | Philippines | 35.00 |
| 54 | Slovakia | 35.00 |
| 55 | Thailand | 35.00 |
| 56 | Vietnam | 35.00 |
| 57 | Venezuela | 34.00 |
| 58 | Canada | 33.00 |
| 59 | Eswatini | 33.00 |
| 60 | Côte d’Ivoire | 32.00 |
| 61 | Lithuania | 32.00 |
| 62 | Mozambique | 32.00 |
| 63 | Poland | 32.00 |
| 64 | Iceland | 31.35 |
| 65 | Bangladesh | 30.00 |
| 66 | Chad | 30.00 |
| 67 | El Salvador | 30.00 |
| 68 | Jamaica | 30.00 |
| 69 | Jordan | 30.00 |
| 70 | Malaysia | 30.00 |
| 71 | Nicaragua | 30.00 |
| 72 | Peru | 30.00 |
| 73 | Rwanda | 30.00 |
| 74 | Saint Lucia | 30.00 |
| 75 | Tanzania | 30.00 |
| 76 | Trinidad and Tobago | 30.00 |
| 77 | Brazil | 27.50 |
| 78 | Cabo Verde | 27.50 |
| 79 | Egypt | 27.50 |
| 80 | Angola | 25.00 |
| 81 | Azerbaijan | 25.00 |
| 82 | Botswana | 25.00 |
| 83 | Costa Rica | 25.00 |
| 84 | Dominican Republic | 25.00 |
| 85 | Equatorial Guinea | 25.00 |
| 86 | Honduras | 25.00 |
| 87 | Iran | 25.00 |
| 88 | Laos | 25.00 |
| 89 | Lebanon | 25.00 |
| 90 | Liberia | 25.00 |
| 91 | Nigeria | 25.00 |
| 92 | Panama | 25.00 |
| 93 | Albania | 23.00 |
| 94 | Czechia | 23.00 |
| 95 | Liechtenstein | 22.40 |
| 96 | Estonia | 22.00 |
| 97 | Armenia | 20.00 |
| 98 | Georgia | 20.00 |
| 99 | Madagascar | 20.00 |
| 100 | Mauritius | 20.00 |
| 101 | Mongolia | 20.00 |
| 102 | Serbia | 20.00 |
| 103 | Sweden | 20.00 |
| 104 | Ukraine | 18.00 |
| 105 | Hungary | 15.00 |
| 106 | Iraq | 15.00 |
| 107 | Kazakhstan | 15.00 |
| 108 | Montenegro | 15.00 |
| 109 | Bolivia | 13.00 |
| 110 | Moldova | 12.00 |
| 111 | Uzbekistan | 12.00 |
| 112 | Bosnia and Herzegovina | 10.00 |
| 113 | Bulgaria | 10.00 |
| 114 | Libya | 10.00 |
| 115 | North Macedonia | 10.00 |
| 116 | Paraguay | 10.00 |
| 117 | Romania | 10.00 |
| 118 | Guatemala | 7.00 |
The VizAtlas dataset includes 118 countries, each with a percentage value assigned to them.
The highest percentage is 57 percent. The lowest percentage is 7 percent. The difference between them is 50 percentage points, which means the highest value is than eight times the lowest value.
The average is 31.81 percent. The middle value is 32.50 percent. Since the middle value is a little higher than the average the lower part of the data is bringing the average down.
The data is also very tight around a well-known percentage ranges.
Eight countries have 40 percent. Another fourteen have 35 percent. Nine countries have 45 percent.. Several more are between 47 percent and 57 percent.
At the top six countries have rates that’re 50 percent or higher. Nine countries have 45 percent or higher. Twenty-four countries have 40 percent or higher. Forty-five countries have 35 percent or higher. Meanwhile 76 of the 118 countries have rates of 30 percent or higher.
That means the ranking is not controlled by a few very high values. There is a middle group.
The Big Pattern
High Tax Rates Cluster Around Progressive Systems
The main trend is that the highest marginal income-tax rates are usually found in tax systems that use personal taxation.
Progressive taxation means that the tax rate increases as income increases.
The idea is simple: people who can afford to pay more, contribute a share of their extra income.
The IMF has said that progressive personal income taxes, along with transfers, are an important way to collect money and reduce income inequality.
Progressive taxation does not mean that everyone pays high taxes. A progressive system can also have:
- Actual Low tax loads for people with low incomes
- Higher tax rates for those who earn more
- Tax credits and exemptions
- Help for families
- Social-security contributions
- Taxes, on goods and services
- And lots of public spending.
That is why the top rate alone does not show what an average person really pays. It gives us a view. That narrower view is still useful.
The Difference Between a Marginal Rate and an Effective Tax Rate
Picture a tax system that is divided into three brackets. Think of it as a cake cut into three slices.
The lowest slice of income is taxed at ten percent. The next slice of income is taxed at twenty‑five percent. The top slice of income is taxed at fifty percent.
Reaching the bracket does not mean a person pays fifty percent of all their income.
Their marginal tax rate remains fifty percent. Their effective average tax rate can be much lower.
This difference is very important when looking at the VizAtlas ranking.
The OECD clearly separates the statutory personal income‑tax rates from effective measures, like the personal average tax rate and the wider labour tax wedge.
The labour tax wedge goes further by adding personal income tax, employee and employer social‑security contributions and some cash benefits.
In 2025, the OECD average tax wedge for a worker on the average wage was 31.5% of labour costs, the highest level in the OECD since 2016.
That figure cannot be directly compared with a percent top marginal income‑tax rate. They just answer different questions.
One measures the tax burden for a worker and household. The other measures the statutory personal income‑tax rate.
Confusing them is like comparing the speed limit with the traffic speed. Both are numbers.
Why Governments Use Marginal Rates
A high marginal income‑tax rate serves several possible purposes.
The first purpose is REVENUE. Governments need money to pay for administration, roads, hospitals, schools, pensions, social protection, defence and other public services.
The second purpose is REDISTRIBUTION. Because high marginal rates target the parts of income progressive tax systems can collect more from high earners and use that money together with transfers and public services.
The third purpose is FISCAL DESIGN. A government may deliberately pair top rates with tax credits, deductions or lower rates for lower incomes.
This creates a system where the headline rate appears high. The real burden varies a lot between households.
The OECDs Taxing Wages 2025 analysis shows why this matters. Tax reliefs like allowances and credits can lower income‑tax rates a lot, especially for families with children and also change how progressive a tax system is.
A 57% rate does not mean that 57% of income goes to the government.
Many people think that the highest marginal income-tax rate tells you how much of the country’s income, the government collects in taxes. That’s not true.
The right way to measure the tax burden is through the tax-to-GDP ratio. This shows how tax revenue the government collects compared to the total size of the economy. It includes more than just personal income tax.
The OECD’s Revenue Statistics framework includes taxes on income, profits, capital gains, payroll, property, goods and services and other sources. Even social-security payments made to the government are counted as taxes in this system.
In 2024, the average tax-to-GDP ratio across OECD countries was 34.1%, based on data. That’s up from 33.7% in 2023. It’s the average recorded for the 38-member OECD group so far.
Now look at this. The average tax-to-GDP ratio was 34.1%.. The VizAtlas dataset shows top personal income-tax rates as high as 57%.
There is no contradiction. These are two things. One measures the tax system compared to national output. The other measures the highest tax rate applied to a person’s income.
Why the Same Tax Rate Can Feel Different
A 40% top marginal tax rate does not mean the same thing in every country. The difference lies in the income level at which that rate starts to apply.
The OECD keeps a database that tracks the income threshold where the highest tax rate begins. That detail is essential.
Imagine two countries both using a 40% rate. In one country, the rate kicks in at 1.5 times the income. In the other country, it only applies at 10 times the income. The headline number is the same.. The real impact? Completely different.
That’s why comparing tax systems requires more than the top rate. You need to know:
- How high is the top rate?
- At what income level does it start?
Without that piece of information, the numbers can be misleading.
Tax credits and allowances change the picture.
Modern tax systems aren’t about brackets. They include credits, deductions and exemptions that can lower what people actually pay.
For example two families earning the gross income might end up with very different tax bills. One might have children. Qualify for a tax credit. The other might not. The tax system treats them differently.
The OECD’s Taxing Wages report shows that tax credits and allowances lower tax rates across household types. They make the system more progressive. That’s why saying “high taxes” is often misleading.
A high statutory rate is not the same as an effective tax burden.. A high effective burden for one group—say, a single person—doesn’t mean it applies to another like a family with kids.
Then there’s the labour tax wedge.
For workers, personal income tax is only a part of the story. Employers may pay social security contributions. Employees might make their contributions. Governments may give cash benefits.
The OECD’s labour tax wedge combines all of this. It measures the cost of labor from the employer’s side versus what workers actually take home.
In 2025, the OECD average labour tax wedge for a worker earning the average wage was 35.1% of labour costs. In 24 of the 38 OECD countries, the average went up. In 11 it went down. In three it stayed the same.
This shows that a country can have a top income tax rate and still have a very different effective tax burden, for the average worker.
The taxpayer’s income level matters. The household’s composition matters. Social contributions matter. Tax credits matter. Benefits matter.
Tax systems are not one-size-fits-all. They are a web. You cannot understand them with just a number.
The Importance of the Tax Base
There is another issue that rankings can hide: the number of people who are actually affected by the tax rate.
If the highest tax bracket starts at a high income level, only a small number of people may fall into it. If the top bracket starts closer to the average income, many more taxpayers could be subject to the highest marginal rate.
That is why a real tax comparison should look at three numbers at the time: the top rate, the point where it starts and the actual rate that people end up paying.
The first shows how fair the top part of the system is.
The second shows how far that top bracket reaches.
The third shows what people actually face.
When all three are considered they give a better overall picture.
What High Tax Rates Can Tell Us About Society
Tax rates are really about choices. They show how governments handle sharing wealth, funding projects and paying for shared services.
A high top marginal rate can show a desire to ask more from people with high incomes.
A lower rate can show a balance between taking less money, encouraging work and getting government income.
No single number tells the story.
The systems around it matter. The way money is spent matters. How income is spread out matters. How many public services are matters. The tax base matters.
This is why a chart of tax rates is more than a financial diagram. It is a chart of ideas, about money and government.
Conclusion: A Tax Rate Is Only the Beginning of the Story
The Countries with the Highest Taxes 2025–2026 ranking shows a range of numbers. In the 118-country VizAtlas dataset, the highest top-tax rate recorded is 57%. The lowest is 7%. The average is 31.81% the median is 32.50%. The middle half of the data is between 25% and 40%.
At first those numbers might seem to answer a question:
Where are taxes the highest?
The real story is much more complex.
The ranking only looks at one part of taxation—the personal income-tax rate—not the full amount of taxes that people and businesses actually pay.
This difference is very important.
The OECD keeps track of personal income-tax rates effective personal tax rates and broader labour tax wedges. Its Revenue Statistics framework also looks at taxes compared to GDP.
These different ways of measuring can show different results.
A country might have a top marginal rate but not apply it to most workers.
A country might have an lower income-tax rate but collect a lot of money through sales taxes and social contributions.
A high tax-to-GDP ratio does not always mean a top marginal rate.
A high tax rate does not always show how well the government uses the money it collects.
The main lesson from the VizAtlas tax map is not that one number is good or bad.
It is that tax systems are built structures. Every tax bracket, limit, every credit, every deduction and every contribution is a choice about who pays, how much they pay and what the government can afford to do in return.
The top marginal rate is the part people see. Beneath it lies a bigger question that every modern society must eventually deal with:
How much should governments take, from whom and for what reason?
That is where the real meaning of the numbers begins.
Subscribe to our $1 newsletter to get new Data and Maps from around the world on various different topics every month. Click here now to join.
Sources
- PwC Worldwide Tax Summaries. Personal Income Tax (PIT) Rates: source of information. PwC defines the headline PIT rate generally as the official personal income-tax rate, including surtaxes but not including local taxes. The current database includes country-level rates reviewed during 2026.
- OECD Revenue Statistics: source to check national taxation structures and tax-to-GDP measures.
- OECD Taxing Wages: check, for labor taxation especially where income tax and social-security contributions differ significantly from the headline PIT rate.
Methodology
Highest Taxes Index Value = highest official headline personal income-tax rate (%)
The ranking uses the headline PIT rate as the only comparable measure. Higher values therefore mean maximum official personal income-tax rates.