Smartest Countries in the World 2025–2026: Ranking Countries by IQ, Education & Cognitive Performance
What does it really mean for a country to be called “smart”?
The question seems simple but the answer is not.
A country can have exceptional maths results without every student becoming a scientist. It can have a educated population without always leading in every type of test. It can spend a lot on schools. Still have problems with fairness in education. It can do well on tests that measure intelligence while still having issues with creativity, real-life skills moving up in society or getting access to education.
So when we talk about the “Smartest Countries Index 2025–2026”, the word ‘smartest’ should not be seen as a way to rank people by how smart they are. But It should be thought of as a way to measure education, how well people learn and some signs of how people perform.
The VizAtlas dataset gives an interesting view. It includes 97 countries with scores from 64.35 to 100. The average score is 84.27. The middle score is 85.87. The top 10 countries have an average of 97.19 while the bottom 10 have an average of 66.90.
The difference is big. But the real story is not just about which country is number one or which is near the bottom.
The important question is what causes high levels of thinking and learning in the first place.
The answer takes us away from the idea that intelligence is just about IQ and leads us to something much bigger: schools, teachers, what people eat, their family life, the way they learn, money, getting to school, thinking challenges and how well institutions help turn potential into real skills.
That is where the real story, about global intelligence starts.
What Does “Smartest Country” Mean?
There is no accepted scientific measure that is called the “smartest country.”
Intelligence is a mental trait whereas a country has a huge group of people who have many different skills, backgrounds and chances. A national average therefore cannot describe every person who lives in a country.
The VizAtlas’s Smartest Countries Index should be seen as a comparison that mixes numbers about education and how well people solve problems.
This difference matters a lot when IQ is involved.
Standard cognitive tests that look at thinking and solving problems, can show how good people are at those skills. The scores can also change because of how much education a person has, what language they use, their culture, their money situation, how familiar they are with test patterns and how well the people chosen for the test represent a whole country. The American Psychological Association says that even tests that try to be fair across cultures can still show cultural ideas assumptions.
In words, an IQ-style number does not give a perfect picture of the whole nation’s brainpower. The number comes from one test that is given to certain people, in certain situations.
That is why educational achievement are an useful extra way to look at a country.
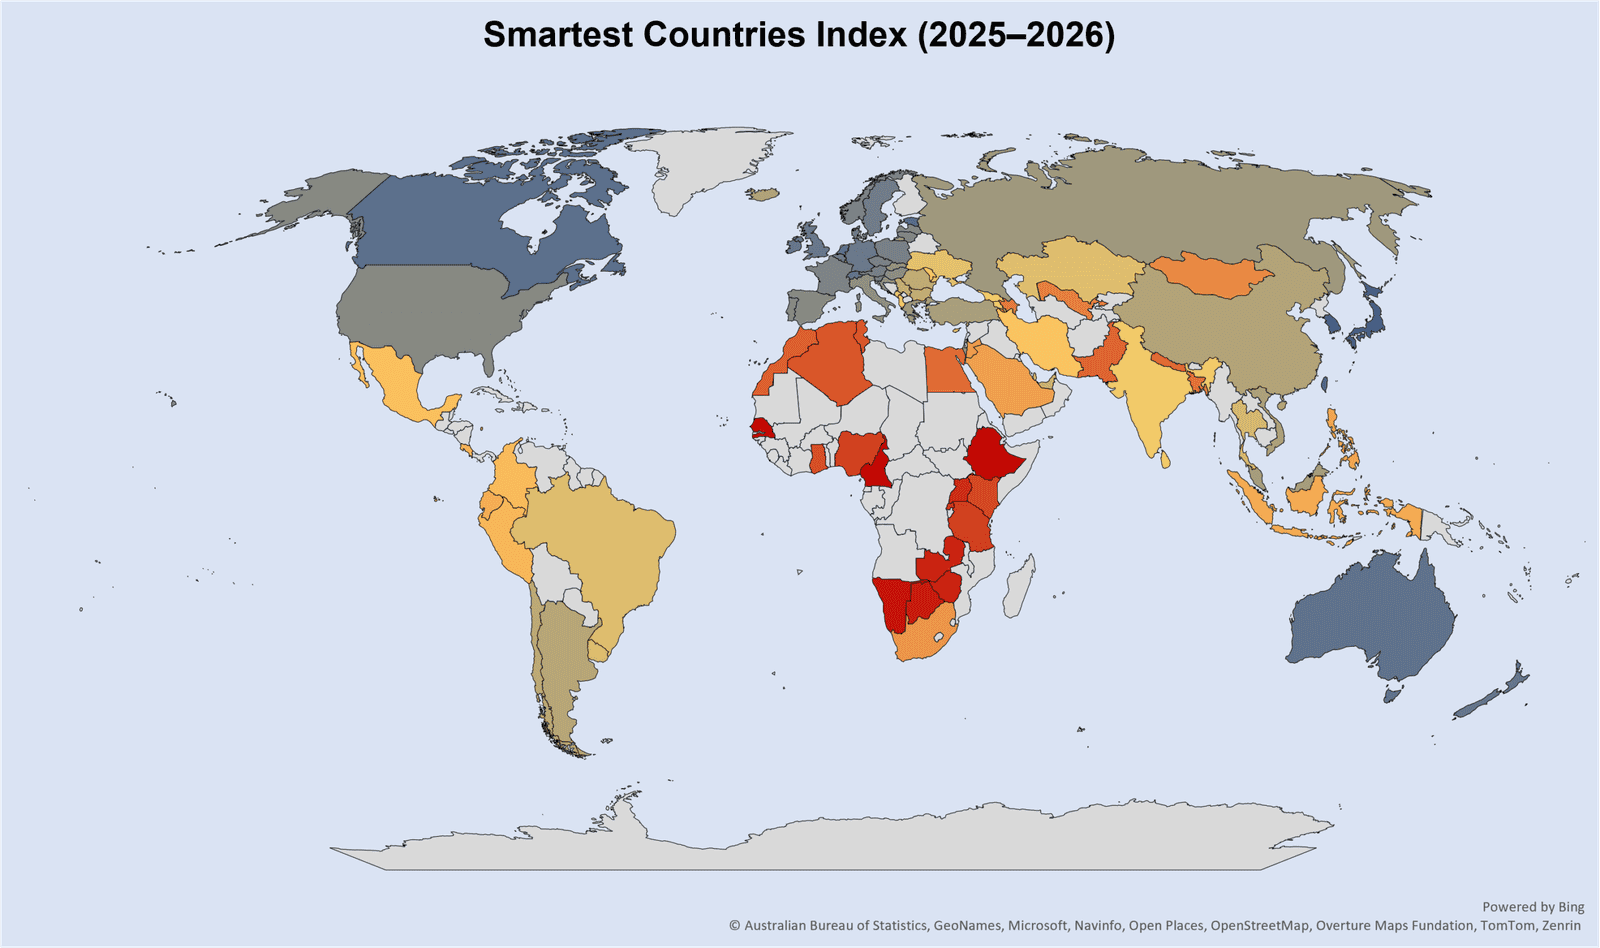
The Data Behind the Smartest Countries Index
| Rank | Country | Smartest Countries Index Value |
|---|---|---|
| 1 | Singapore | 100.00 |
| 2 | Japan | 98.74 |
| 3 | South Korea | 98.42 |
| 4 | Taiwan | 97.71 |
| 5 | Estonia | 96.83 |
| 6 | Finland | 96.61 |
| 7 | Canada | 96.28 |
| 8 | Netherlands | 95.94 |
| 9 | Australia | 95.76 |
| 10 | Switzerland | 95.58 |
| 11 | New Zealand | 95.41 |
| 12 | Ireland | 95.26 |
| 13 | United Kingdom | 95.14 |
| 14 | Germany | 94.92 |
| 15 | Belgium | 94.67 |
| 16 | Denmark | 94.53 |
| 17 | Sweden | 94.41 |
| 18 | Slovenia | 94.17 |
| 19 | Austria | 93.98 |
| 20 | Poland | 93.82 |
| 21 | Czechia | 93.69 |
| 22 | Norway | 93.52 |
| 23 | France | 93.34 |
| 24 | Lithuania | 92.98 |
| 25 | Latvia | 92.76 |
| 26 | United States | 92.54 |
| 27 | Portugal | 92.38 |
| 28 | Spain | 92.21 |
| 29 | Hungary | 91.96 |
| 30 | Italy | 91.73 |
| 31 | Croatia | 91.48 |
| 32 | Slovakia | 91.24 |
| 33 | Israel | 90.97 |
| 34 | Greece | 90.71 |
| 35 | Russia | 90.42 |
| 36 | Luxembourg | 90.18 |
| 37 | Malaysia | 89.83 |
| 38 | Türkiye | 89.47 |
| 39 | Vietnam | 89.21 |
| 40 | Iceland | 88.96 |
| 41 | China | 88.72 |
| 42 | Argentina | 88.31 |
| 43 | Chile | 87.94 |
| 44 | Romania | 87.61 |
| 45 | Bulgaria | 87.28 |
| 46 | Serbia | 86.94 |
| 47 | United Arab Emirates | 86.57 |
| 48 | Qatar | 86.21 |
| 49 | Thailand | 85.87 |
| 50 | Uruguay | 85.52 |
| 51 | Brazil | 85.14 |
| 52 | Kazakhstan | 84.78 |
| 53 | Ukraine | 84.43 |
| 54 | Montenegro | 84.08 |
| 55 | Cyprus | 83.74 |
| 56 | India | 83.39 |
| 57 | Sri Lanka | 82.96 |
| 58 | Armenia | 82.61 |
| 59 | Georgia | 82.24 |
| 60 | Albania | 81.88 |
| 61 | Moldova | 81.47 |
| 62 | Iran | 81.16 |
| 63 | Mexico | 80.72 |
| 64 | Colombia | 80.34 |
| 65 | Peru | 79.96 |
| 66 | Costa Rica | 79.58 |
| 67 | Ecuador | 79.19 |
| 68 | Indonesia | 78.82 |
| 69 | Philippines | 78.41 |
| 70 | Saudi Arabia | 77.96 |
| 71 | Jordan | 77.51 |
| 72 | South Africa | 77.08 |
| 73 | Mongolia | 76.18 |
| 74 | Bahrain | 75.81 |
| 75 | Brunei | 75.42 |
| 76 | Uzbekistan | 75.06 |
| 77 | Azerbaijan | 74.67 |
| 78 | Bangladesh | 74.22 |
| 79 | Egypt | 73.81 |
| 80 | Nepal | 73.34 |
| 81 | Pakistan | 72.89 |
| 82 | Morocco | 72.44 |
| 83 | Tunisia | 71.97 |
| 84 | Algeria | 71.53 |
| 85 | Ghana | 70.96 |
| 86 | Kenya | 70.48 |
| 87 | Nigeria | 69.94 |
| 88 | Tanzania | 69.41 |
| 89 | Rwanda | 68.87 |
| 90 | Uganda | 68.29 |
| 91 | Zambia | 67.76 |
| 92 | Zimbabwe | 67.19 |
| 93 | Botswana | 66.63 |
| 94 | Namibia | 66.08 |
| 95 | Senegal | 65.47 |
| 96 | Cameroon | 64.91 |
| 97 | Ethiopia | 64.35 |
The VizAtlas dataset contains 97 ranked countries. The VizAtlas dataset assigns index values that range from 64.35 up to 100.
The maximum score in the VizAtlas dataset is 100. The minimum score in the VizAtlas dataset is 64.35. That gives the VizAtlas dataset a range of 35.65 points.
The mean score of the VizAtlas dataset is 84.27. The median score of the VizAtlas dataset is 85.87.
That difference is revealing. Because the median score of the VizAtlas dataset is above the score of the VizAtlas dataset the lower-scoring portion of the VizAtlas dataset pulls the arithmetic average downward. In terms the distribution of the VizAtlas dataset is concentrated rather strongly toward the upper end of the scale even though a sizeable lower tail remains.
The middle 50% of the VizAtlas dataset stretches from about 76.18 to 92.76. That gives the VizAtlas dataset a 16.58-point interquartile range.
The 90th percentile of the VizAtlas dataset is around 95.48. That means only a small upper group of the VizAtlas dataset reaches the very highest part of the index.
The thresholds of the VizAtlas dataset provide a clearer picture.
Thirteen of the 97 entries in the VizAtlas dataset score least 95. Thirty-six entries in the VizAtlas dataset reach 90 or above. Fifty-one entries in the VizAtlas dataset reach 85 or above. Sixty-four entries in the VizAtlas dataset score least 80. Seventy-six entries in the VizAtlas dataset reach 75 or above. Ninety-five entries, in the VizAtlas dataset score at least 65.
This is not a ranking in which most observations are clustered around the bottom of the VizAtlas dataset. It is a ranking in which the vast majority of the VizAtlas dataset sit above the midpoint of the index scale while the main differentiation occurs among high-performing groups of the VizAtlas dataset.
The Big Pattern
Education Is the Infrastructure Behind Cognitive Performance
The biggest mistake in discussions about intelligence is thinking that thinking abilities exist on their own independently from the world.
They don’t.
A child grows up in a environment.
Food is important. Being healthy is important. How much money the family has is important. Learning experiences are important. How good the school is matters. How good the teachers are matters. What language a child hears matters. Having access to books and computers matters. How much time is spent learning matters and then there is the education system.
A good education system doesn’t just teach kids facts. It helps them think through math problems, understand what they read, use science ideas, solve problems and use what they know in unfamiliar situations.
That is why tests like the OECDs Programme for International Student Assessment or PISA are helpful to understand things. PISA checks how 15-year-old students apply what they know in math, reading and science in real-life situations.
This makes how well students do in school, a good sign of how the thinking environment is, in a country. The key word is environment.
What PISA Actually Tells Us
The latest full PISA results used in this analysis are from the 2022 assessment. That year 700,000 students were tested across 81 countries and economies. The findings showed differences between nations when it came to student performance.
In OECD countries average math scores dropped by 15 points from 2018 to 2022. Reading scores also fell, by 10 points. The OECD called the drop in math performance something never seen before in the history of the test. This shift changes how we should think about rankings that label countries as the “smartest.”
Even countries with long-standing strong education systems are not safe from falling learning outcomes. Educational performance isn’t something you achieve once and then keep forever. It must be maintained. Sometimes it needs to be rebuilt
The difference between knowledge and intelligence
A student who does well in math might have good reasoning skills. That doesn’t mean math performance equals intelligence. Similarly being good at reading does not mean someone is more intelligent overall. Having scientific knowledge does not automatically mean strong general cognitive ability.
Each of these measures captures a different thing. Math tests can show how well a person handles numbers and solves problems. Reading tests reveal comprehension, understanding of text and the skill to work with written information. Science assessments check how people apply ideas and reason through experiments and data.
IQ tests focus on mental skills like pattern recognition, logical thinking and processing speed. Educational attainment measures something how far individuals go in formal schooling.
So the best way to interpret what the VizAtlas index shows is not that a population has a level of intelligence. Instead it means:
This country performs at a level, across selected indicators tied to education and cognitive skills. That is a clearer and more accurate way to describe the results.
Why IQ Proxies Are So Difficult to Compare?
Intelligence scores between countries are interesting because they take a interesting topic and turn it Simple. That is easiest way to look at it but it can be wrong.
An intelligence test is made for a language, culture, testing method and group of people. Even tests that don’t use words can have different ideas built in.
Studies about testing intelligence across cultures have found problems with language how good the education is, who is tested and the background of the people.
A recent study on an intelligence test that was adapted for a culture, found that the group used for comparison and how much the test was changed for the new culture could affect how accurate the scores were. The American Psychological Association also says that tests can show biased results even when they are made to be culturally fair.
That does not mean testing intelligence is not helpful. It means that the results need context.
A country’s intelligence score should never be seen as proof that one group of people is naturally better than another. The setting where the test is taken is very important.
The Role of Education Is Hard to Ignore
Education is not just linked with how people do on cognitive tests. It also gives people a chance to build skills.
Students who spend years studying math meet harder and more abstract ideas. Students who read a lot build vocabulary and better understanding. Students who do science experiments learn to make guesses look at evidence and change their minds.
Education gives chances to practice. Practice builds skill. Skill changes how well someone does.
Studies on how people learn have shown how important surroundings are. Research has connected thinking results with things like family, money, parental education, being physically active and the schools people go to.
That makes the phrase “Smart Country” a bit confusing.
Usually what the numbers are really showing is a country that has become good, at helping people grow, support and measure thinking skills.
That is a different- and much better idea.
The Human Capital Connection
The World Bank‘s Human Capital Connection is a way to understand the issue with more unbiasedness.
Human capital is not about how long people go to school. It includes the health, knowledge, skills and abilities that people gain and use through their lives.
The Human Capital Index Plus from the World Bank updated in 2026 clearly brings together factors like health, education and jobs to estimate the capital a child can expect to gain during their working life under current conditions.
This offers a conceptual connection.
A country with education results is not necessarily “smart” because its people have some special national brain power. It might have created systems that help more people learn and use skills. That is probably the important success.
The Importance of Educational Equality
Average scores can hide differences inside a country.
Think of a country where a small group gets good education while millions get bad schooling. The national average might look okay. The system is not necessarily creating wide human capital.
That is why education research around the world is not only looking at results but also at fairness.
PISA 2022 showed differences based on socioeconomic difference in student success while also finding education systems that have better results and more fairness in learning chances.
This adds another point to the smartest-countries discussion: How widely is education available?
A country that creates exceptional students is doing something great.
A country that helps students from all kinds of backgrounds, reach great levels is showing something else: systems that work well for many people together.
Why Early Childhood Matters
The base for thinking and learning starts before college.
Early childhood nutrition talking, parents spending time, health and learning settings can affect school results.
That means national intelligence rankings can be wrong if they only look at students or adults.
By the time a teenager takes a test, years of influences have already happened. The test result is partly about the persons thinking and partly, about their growing up.
This is one reason international comparisons should be seen as results of social systems and not just measures of natural ability.
The Digital Age Is Changing What “Smart” Means
There is another twist. Traditional intelligence assessments were made when information was scarce.
Modern society is the reverse. Information is everywhere.
A smartphone can fetch an amount of factual knowledge in seconds. That shifts the value placed on skills. Knowing a fact becomes less important than knowing how to evaluate it.
The ability to spot information versus misinformation and to understand probability to reason through uncertainty, to read graphs and to spot weak arguments is becoming more valuable.
This is why modern education systems focus on skills than on memorization alone. The smartest education system may not create students who remember the facts. Smart Schools may produce students who know how to think when facts are incomplete.
What the Data Does Not Tell Us
The VizAtlas’s Smartest Countries Index gives a comparison but index does not measure every form of intelligence.
Creativity is hard to capture.
Entrepreneurial ability is hard to capture.
Practical intelligence is hard to capture.
Social intelligence is hard to capture.
Leadership, artistic ability, craftsmanship and emotional intelligence cannot be reduced to one score.
This means the scores should be shown as VizAtlas index values not as measures of IQ or educational attainment. This distinction is especially important.
What the Ranking Actually Measures
When looked at closely the “Smartest Countries Index” is not a score sheet of intelligence but a map of human ability in different school and social settings.
The highest scores show where many factors join together strongly inside the index system.
Strong schooling. High learning outcomes. Cognitive performance. Educational attainment. Access to learning. Institutional capacity.
The lower end of the scale does not mean that people living there lack intelligence.
It can instead show differences in school access, learning places, money, health, roads, test coverage and other things that shape what can be measured.
That difference turns the ranking from a contest into a much more interesting question about what societies do with human potential.
Conclusion: The Smartest Countries Are Really Learning Societies
The phrase ” countries” makes for an irresistible headline but the numbers tell a more detailed story.
The VizAtlas’s Smartest Countries Index 2025–2026 lists 97 countries. Goes from 64.35 to 100 with an average of 84.27 and a median of 85.87. The top 10 average 97.19, while the bottom 10 average 66.90. The middle half of all countries falls between 76.18 and 92.76 showing that a large part of the ranking is in the half of the index.
Those numbers show a organized variation in measured education and cognitive performance.
They do not reveal a hierarchy of human worth.
They do not prove that one population is inherently more intelligent than another.
They certainly cannot reduce the extraordinary complexity of human intelligence to a single decimal point.
What they can do is show where educational outcomes and selected cognitive proxies are strongest inside a defined index. That makes the ranking useful.
International evidence supports the picture. PISA shows differences in math, reading and science performance across school systems and also shows that learning results can drop quickly and that money and social background stay important. UNESCOs global monitoring also shows that millions of children still do not reach skill levels.
The implication is bigger than any ranking.
If cognitive performance can be shaped by school quality, health, money and learning places then the global intelligence map is not fixed.
It can move.
A society can improve its schools.
It can train teachers.
It can expand access.
It can reduce inequality in learning opportunities.
It can strengthen childhood development.
It can invest in science, mathematics, reading and critical thinking.
Over time those investments can change what people can do. Perhaps that is the interesting thing, the Smartest Countries Index 2025–2026 shows.
The worlds intellectual landscape is not a map of who was born clever. It is also a map of where human potential’s being developed most effectively.
That makes the real competition not about who has the most smartest people. But It is, about who’s building the smartest learning systems—and giving the largest possible share of their population the chance to become smarter.
Subscribe to our $1 newsletter to get new Data and Maps from around the world on various different topics every month. Click here now to join.
Sources
OECD PISA 2025: The recent international student-assessment cycle, published in September 2026 includes more than 760,000 students from 91 countries and economies. It tests mathematics, reading and science. Also has a part on computational problem solving.
OECD Survey of Adult Skills (PIAAC) 2023: Gives data on adult literacy, numeracy and adaptive problem-solving that can be compared between countries. Finland, Japan, Sweden and Norway did well in these areas.
UNDP Human Development Report 2025: Education indicators such as years of schooling and expected years of schooling are used as a way to show education capacity.
International IQ Test / World Population Review 2026: Offers a 2025 online IQ dataset covering 143 regions. Since IQ samples are self-selected and comparing national IQs has many problems IQ is only used as an extra measure and not as the main way to show national intelligence.
TIMSS 2023: Math and science results are used as an extra source of student performance data for countries that are not well covered in PISA.
Methodology
The Smartest Countries Index (SCI) 2025–2026 is a custom index made for this purpose. It does not claim to show the intelligence of people, in a country. Instead it looks at education and cognitive-performance measures that can be seen and compared internationally.
| Component | Weight |
|---|---|
| PISA student performance | 40% |
| Adult literacy, numeracy & problem solving | 25% |
| Education attainment | 20% |
| Standardized IQ proxy | 15% |
| Total | 100% |