Most Polluted Countries in the World 2025–2026: PM2.5 Rankings, Air Quality & Global Pollution Explained
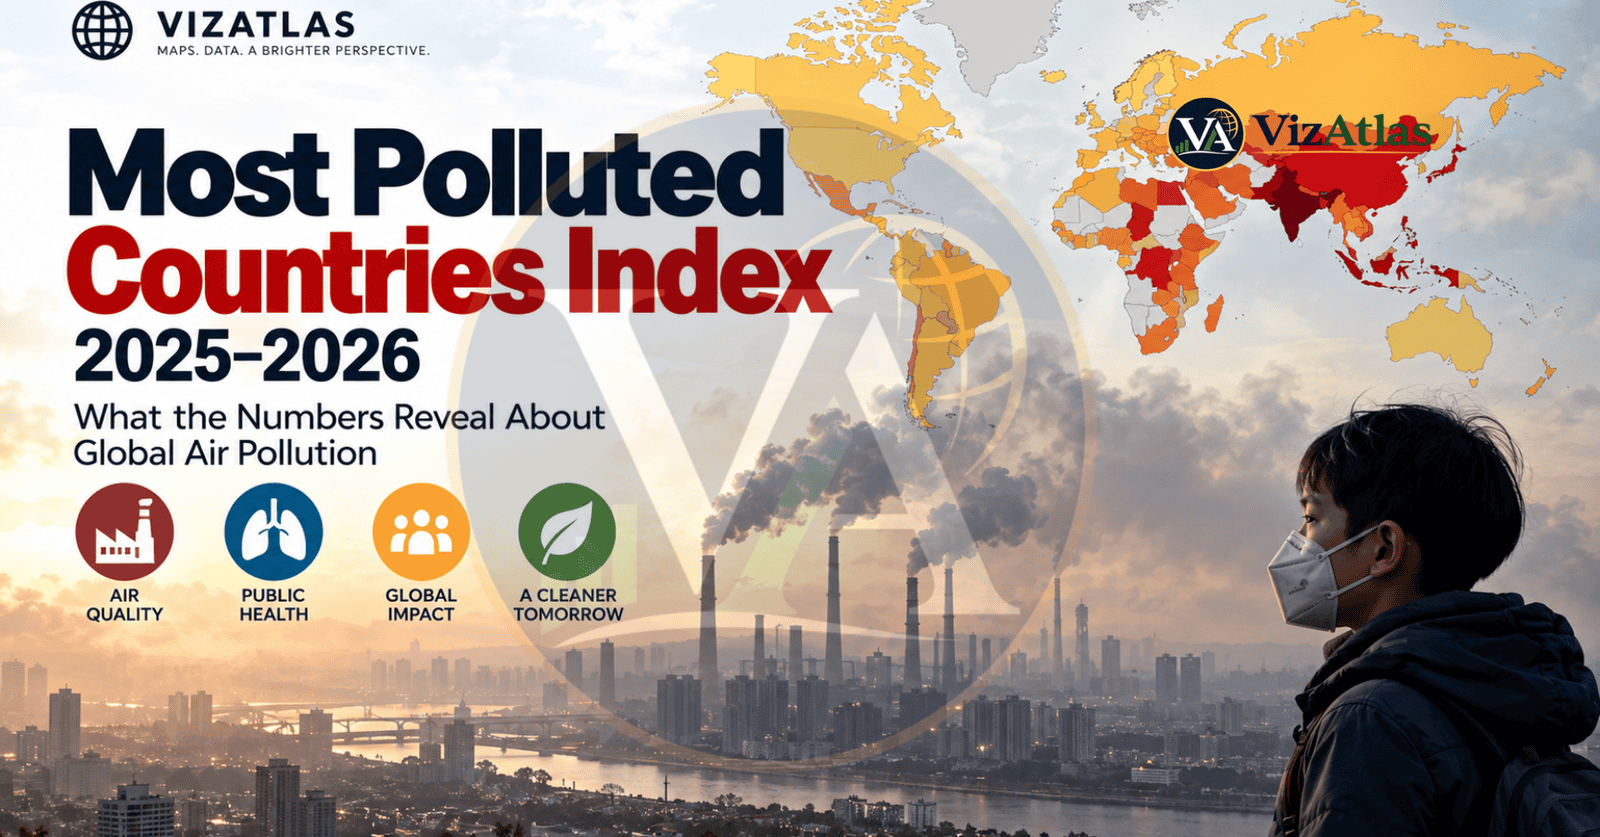
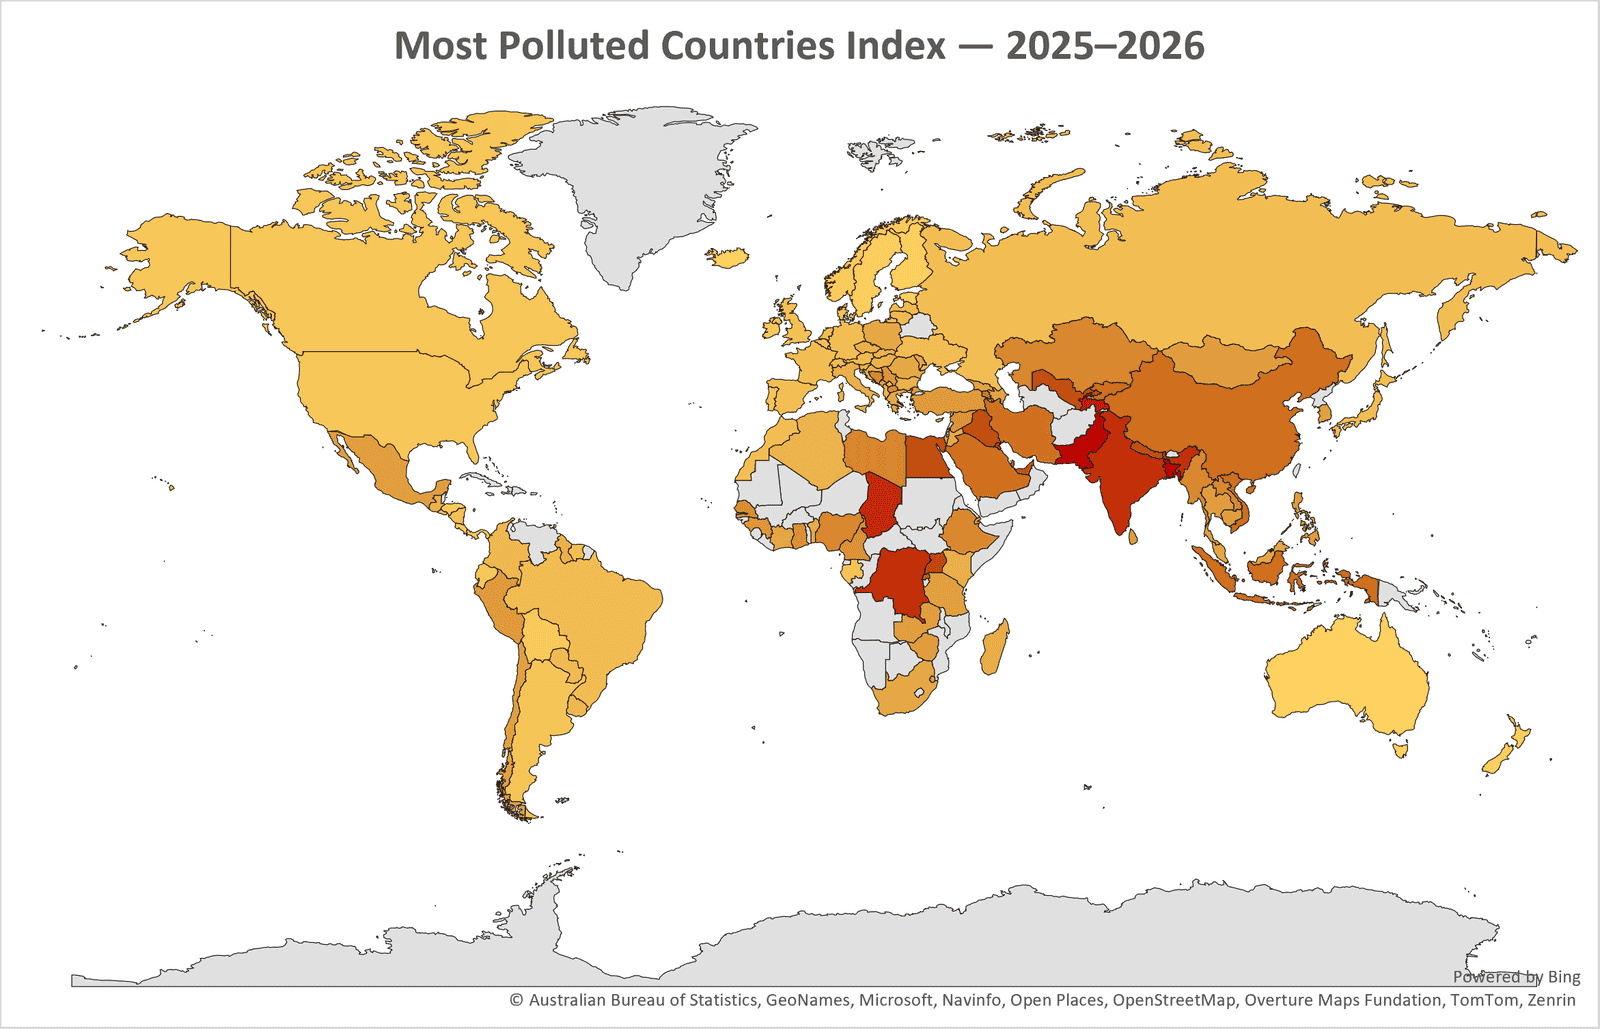
A map can make pollution seem almost misleadingly simple.
A darker shade means pollution and a lighter shade means less. In between is the big complicated system in the air that decides what millions of people breathe every single day.
Behind the colors is a number that matters a lot more than the difference in color: the yearly average level of PM25 in the air.
The newest worldwide information shows a uncomfortable trend. In the 131-country list used for this ranking, pollution levels go from 2.6 ug/m3 to 67.3 ug/m3. The median value is 14.8 ug/m3 while the average is 17.88 ug/m3. At the top, the ten worst places have an average level of 51.08 ug/m3.
The World Health Organizations yearly limit for PM25 is 5 ug/m3 and levels above that’re linked to more health dangers the WHO says. The organization adds that tiny particles can go into the lungs and cause heart and breathing problems.
The map therefore shows a larger story than just which areas look worst. It shows how unequal the worlds exposure, to tiny-particle pollution still is. And how many people live from the level of clean air that health guidelines say is safe.
What Does the “Most Polluted Countries” Index Actually Measure?
The phrase “Most Polluted Countries Index” sounds like an environmental score but the VizAtlas visualization is actually much more specific.
The values correspond to average PM2.5 concentration, measured in micrograms per cubic metre (µg/m³) from IQAirs 2025 World Air Quality Report.
PM2.5 means particulate matter that’s 2.5 micrometres or smaller. These tiny particles can go into the lungs, which is why PM2.5 is a key indicator of air pollution.
IQAirs 2025 global report looked at data from 9,446 cities in 143 countries, regions and territories. It used information from over 40,000 monitoring stations and many low‑cost sensors.
The VizAtlas dataset contains 131 country‑level entries, taken from that reporting pool. This is not a ranking of every type of pollution. It does not mix plastic waste, dirty water, industrial toxins, greenhouse‑gas emissions, noise pollution and air quality into one huge environmental score. Instead it looks at one of the most important and measurable parts of environmental health: long‑term exposure to fine particulate matter in outdoor air.
That focus makes the numbers especially useful when comparing countries, around the world.
| Rank | Country | Pollution Index Value |
|---|---|---|
| 1 | Pakistan | 67.3 |
| 2 | Bangladesh | 66.1 |
| 3 | Tajikistan | 57.3 |
| 4 | Chad | 53.6 |
| 5 | Democratic Republic of the Congo | 50.2 |
| 6 | India | 48.9 |
| 7 | Kuwait | 45.7 |
| 8 | Uganda | 43.0 |
| 9 | Egypt | 40.6 |
| 10 | Uzbekistan | 38.1 |
| 11 | Iraq | 38.1 |
| 12 | Nepal | 37.4 |
| 13 | United Arab Emirates | 36.4 |
| 14 | Bahrain | 35.9 |
| 15 | Rwanda | 34.5 |
| 16 | Qatar | 33.9 |
| 17 | Indonesia | 30.0 |
| 18 | Vietnam | 29.7 |
| 19 | Kyrgyzstan | 29.7 |
| 20 | China | 29.6 |
| 21 | Saudi Arabia | 28.9 |
| 22 | Iran | 28.1 |
| 23 | Gambia | 27.7 |
| 24 | Armenia | 26.9 |
| 25 | Libya | 24.4 |
| 26 | Myanmar | 23.5 |
| 27 | Bosnia and Herzegovina | 23.4 |
| 28 | Nigeria | 23.4 |
| 29 | Kazakhstan | 23.4 |
| 30 | Laos | 22.6 |
| 31 | Ethiopia | 22.4 |
| 32 | Senegal | 21.8 |
| 33 | Ghana | 21.3 |
| 34 | North Macedonia | 21.2 |
| 35 | Cameroon | 21.0 |
| 36 | Syria | 20.5 |
| 37 | Guinea | 20.0 |
| 38 | Serbia | 19.8 |
| 39 | Türkiye | 19.2 |
| 40 | Peru | 19.1 |
| 41 | Philippines | 19.0 |
| 42 | Sri Lanka | 18.9 |
| 43 | Eswatini | 18.9 |
| 44 | Djibouti | 18.8 |
| 45 | Zimbabwe | 18.4 |
| 46 | Cambodia | 18.1 |
| 47 | Mongolia | 17.8 |
| 48 | Thailand | 17.8 |
| 49 | Zambia | 17.6 |
| 50 | Mexico | 17.6 |
| 51 | Tanzania | 17.5 |
| 52 | Palestine | 17.4 |
| 53 | Chile | 17.2 |
| 54 | South Korea | 17.1 |
| 55 | Georgia | 16.9 |
| 56 | Israel | 16.6 |
| 57 | Montenegro | 16.5 |
| 58 | Azerbaijan | 16.4 |
| 59 | Malaysia | 16.0 |
| 60 | Côte d’Ivoire | 15.8 |
| 61 | Moldova | 15.7 |
| 62 | South Africa | 15.5 |
| 63 | Romania | 15.4 |
| 64 | Poland | 15.4 |
| 65 | Greece | 14.9 |
| 66 | Jordan | 14.8 |
| 67 | Benin | 14.4 |
| 68 | Madagascar | 14.0 |
| 69 | Kenya | 13.5 |
| 70 | Croatia | 13.4 |
| 71 | Italy | 13.3 |
| 72 | Guyana | 13.2 |
| 73 | Guatemala | 13.0 |
| 74 | Czechia | 13.0 |
| 75 | Slovakia | 12.7 |
| 76 | Bulgaria | 12.7 |
| 77 | Hungary | 12.7 |
| 78 | Albania | 12.6 |
| 79 | Algeria | 12.5 |
| 80 | Slovenia | 12.4 |
| 81 | Singapore | 11.9 |
| 82 | Cyprus | 11.8 |
| 83 | Kosovo | 11.5 |
| 84 | Uruguay | 11.5 |
| 85 | Colombia | 11.1 |
| 86 | Lithuania | 10.5 |
| 87 | Latvia | 10.5 |
| 88 | Austria | 10.4 |
| 89 | Paraguay | 10.4 |
| 90 | Brazil | 10.0 |
| 91 | Japan | 9.8 |
| 92 | Ukraine | 9.8 |
| 93 | Netherlands | 9.7 |
| 94 | San Marino | 9.7 |
| 95 | Switzerland | 9.7 |
| 96 | Russia | 9.6 |
| 97 | France | 9.6 |
| 98 | Morocco | 9.6 |
| 99 | Germany | 9.4 |
| 100 | Belgium | 9.3 |
| 101 | Suriname | 9.2 |
| 102 | Spain | 9.1 |
| 103 | Malta | 8.9 |
| 104 | El Salvador | 8.9 |
| 105 | Nicaragua | 8.8 |
| 106 | Maldives | 8.8 |
| 107 | United Kingdom | 8.7 |
| 108 | Gabon | 8.3 |
| 109 | Denmark | 8.2 |
| 110 | Portugal | 7.9 |
| 111 | Argentina | 7.7 |
| 112 | Luxembourg | 7.4 |
| 113 | Canada | 7.4 |
| 114 | Ecuador | 7.3 |
| 115 | United States | 7.3 |
| 116 | Ireland | 6.8 |
| 117 | Bolivia | 6.4 |
| 118 | Honduras | 6.3 |
| 119 | Norway | 6.2 |
| 120 | Costa Rica | 6.1 |
| 121 | Trinidad and Tobago | 5.5 |
| 122 | Sweden | 5.5 |
| 123 | Finland | 5.2 |
| 124 | New Zealand | 5.1 |
| 125 | Estonia | 4.9 |
| 126 | Panama | 4.8 |
| 127 | Grenada | 4.7 |
| 128 | Australia | 4.4 |
| 129 | Andorra | 4.3 |
| 130 | Iceland | 3.7 |
| 131 | Barbados | 2.6 |
The WHO Guideline Creates a Striking Benchmark
The WHO recommends an average PM2.5 of 5 µg/m³. That is a very useful benchmark figure as you can see here. Of the 131 entries provided for this ranking 124 report a PM2.5 that is over 5 µg/m³.
That is around 94.7% of the entries that exceed the WHO annual guideline. Seven fall at or below 5 µg/m³. However, this does not mean that 94.7% of countries in the world are failing the WHO PM2.5 guideline. This statistic is specific to the 131-country.
The full IQAir dataset for 2025 covers 143 countries, regions and territories and IQAir reports that only 13 of those 143 met the WHO PM2.5 guideline while 130 exceeded it. The two figures tell the general story. Clean air according to the WHO guidelines is still a rarity, in country data overall.
Pollution Does Not Rise in Equal Steps
What does a dataset say when you sort values based on concentration? Here’s the data.
Out of 131 entries, only 7 are at or below µg/m³. Want to know what the next group is? 35 entries are above 5 but at or below µg/m³. Now the interesting part begins: 25 entries are between 10 and µg/m³ and 40 between 15 and 25 µg/m³.
Now here’s whats really concerning: The number of samples decreases as we go higher. The concentrations increase. 10 Of the entries are between 25-35 µg/m³, 9 between 35-50 µg/m³ and only 5 of the samples are above 50 µg/m³.
This creates a pyramid shape. The middle part is wide. The lower part has even fewer entries even though they are further away from the health guidelines.
So how does it measure up? IQAirs 2025 rating says that PM2.5 of 50.1 µg/m³ would be more than 10 times the WHO safe limit of 5 µg/m³. 35.1-50 µg/m³ is about seven to ten times more than the WHO safe limit and 25.1-35 µg/m³ is about five to seven times more than the WHO safe limit.
At these levels “pollution” seems like a inadequate word. doesn’t it? The numbers show a long-term presence of high levels of fine particles.
The Geography of the Problem Is Not Random
Ever wondered why some places have pollution higher than others? The map gives a bit of a clue showing some natural features. When you look at the map you can see the levels of pollution in areas of South and Central Asia. Also there are levels in parts of the Middle East and Africa.
This also means that the places with the lower levels are often small island nations, rich temperate countries and places that don’t have a lot of pollution from factories and cities. What if where you live isn’t the real reason? Geography alone isn’t the reason for pollution.
The truth is: weather, land shapes, money systems, power sources, how crowded cities are, how people move around, farming, the fuels people use at home, factories and the time of year, all play a role. Think about it: a city or country that is in a valley surrounded by mountains might have different pollution levels than one that has great air flow.
The weather is important factor as well. When pollution is released in a place with wind and rain, the pollution might move away. Get cleaned up faster than in a calm time. Pollution is not a geography issue but also an economic, a technology and a weather issue. What do you think are the causes of pollution in your area?
Why PM2.5 Becomes So High
Have you ever noticed how the air around us sometimes feels thick and full of particles? It’s not one single thing that is causing it.
According to the WHO, big causes of air polutants include how much energy your home uses, the cars you drive, the type of power you use, the emissions from factories, how you use the land, how you farm and how you burn waste.
All these things come together in one place. These sources can mix in stronger ways, all inside one city.
Just to remind you: Traffic doesn’t only make exhaust gases. It also makes particles that float in the air. And then there’s industry. It sends all kinds of fine particles into the air. Construction sites. They make a lot of dust too.
And don’t forget power plants, the bad stuff they make depends on what fuel they use and what technology they have. We get big spikes in pollution during certain times of the year because of farms burning fields nearby.
Lets not forget about things people do at home.
Are you still using things like wood or coal to cook or heat parts of your house? This smoke doesn’t just stay inside your home. It can also go outside. Make the air bad there too. Also Don’t forget about nature and the weather.
Dust storms can bring a lot of particles into the air. Wildfires can send smoke across an area and the weather can affect how long the bad air stays near the ground.
So pollution isn’t a problem in cities. It’s a changing system, in the air made up of sources how the bad stuff moves around and how it builds up.
The Industrialization Puzzle
Have you ever wondered how air pollution changes as economic development grows? Believe it or not, there is no single pattern of pollution that follows rising income.
There can be a rise in air pollution. Why? Because as construction of new buildings rise, more vehicles travel on roads, more factories and More electrical power is required.
The key point is: Over time we can reduce costs and improve technology.
Cleaner fuels, cleaner power plants, stricter emissions standards, efficient public transportation, vehicle regulations, industrial filters, renewable electricity and smarter waste management can all help reduce particulate emissions.
Thus this creates a relationship between economic development and air quality.
Is it possible for a country to become cleaner and wealthier at the time? Yes it is. But that does not happen automatically.
The outcome is also driven by technology, good governance, strong infrastructure and the delay, between development and new environmental standards.
What history of air pollution teaches us about greener growth is that economic development and clean air need not be enemies. Cleaner growth requires systems and investments.
The Relationship Between Pollution and Population Is Complicated
You think the crowded places in the world must be the dirtiest? Not always.
Honestly it’s a bit more involved than that.
You Bet. Larger groups of people can create a lot of pollution from different sources-transport, power, buildings and factories. Don’t be tricked by that-population size isn’t the only thing that matters when it comes to PM2.5.
Pollution is affected by four things: The kind and level of emissions, the weather and the technology used to control pollution.
Here’s the thing: For example, a place that has a lot of people but modern emission controls might have lower yearly PM2.5 levels than a place with few people but outdated energy systems and poor air movement.
Oh. By the way! Places with less numbers of people can still suffer a lot from pollution if they are near areas with a lot of emissions, from factories or the way the land is shaped.
So yes, population is part of the picture. But it isn’t the whole truth.
Why the 5 µg/m³ Threshold Is So Important
It is more than a dot on a chart. It changes the shape of the data.
Did you know that the highest value in the data set at 5 µg/m³ is over thirteen times the WHO guideline? The number fifty is an high value at this depth and it isn’t worth ignoring it.
The median is 14.8 µg/m³ which is almost three times the guideline. What about the average of 17.88 µg/m³? It is greater than 3.5 times the guideline.
Here is the problem: the top ten average is 51.08 µg/m³ – more than ten times the guideline. Sure rankings show order, but health standards show the amount. That is the combination that truly makes the data meaningful.
Conclusion: The Air Around Us Is a Global Data Story
This index reveals the state of air pollution across the globe. It is more than a list of numbers. It shows a difference in how people experience air quality. The fine particles in the air – known as PM2.5 – are tiny but dangerous. Why should this matter to you?
Looking at the Ranking, we find that annual average PM2.5 levels range from 2.6 to 67.3 µg/m³. The median is 14.8. The average is 17.88.. The top ten countries? Their average is a 51.08 µg/m³.
This shows a gap in air quality around the world. The rankings come with some important context.
It’s not accurate to say one country’s pollution is “26 times worse” than another. The reasons are complex. Geography plays a role. Climate matters. So does where pollution is measured and how it spreads across a nation. A single national average can hide what people actually breathe in cities or regions.
Still the big picture is clear.
The World Health Organization says the safe level for PM2.5 is 5 µg/m³ per year. Every country in the ranking exceeds that limit. So does IQAir’s 2025 estimate – a few places meet it. Air pollution is not an issue. We can measure it in one unit while the causes are many and different.
PM2.5 is invisible. It is colorless. It is so small it can go into lungs. That makes it easy to ignore until the data tells the truth. It hits hard. It shows that clean air is not a distributed equally for everyone.
So the real question is not just which countries are the most polluted. It is much bigger: Why do some people breathe pure air while others breathe air that is many times dirtier? What systems create this difference?
The answer lies in energy use, city planning, economic power, scientific access, geography and human health. That is the story behind the rankings.
Maybe the important lesson, from this map of pollution is this: even when the sky cannot be seen, inequality can be.
Subscribe to our $1 newsletter to get new Data and Maps from around the world on various different topics every month. Click here now to join.
Sources
- Want to find out how your city compares for air quality? Here are the details from the 2025 World Air Quality Report by IQAir. They measured air quality in 9,446 cities across 143 regions using one of the monitoring networks on Earth – more than 40,000 individual sensors!
- But here is the surprise: WHO guidelines say that the annual PM2.5 concentration should be no than 5 µg/m³. Unfortunately only 13 of the 143 regions in the world met the guideline in 2025. Out of 143 regions only 13. Can you imagine?
Methodology
How did we rank the most polluted places? We used a Pollution Index Value, which is the annual average PM2.5 concentration for 2025. In terms, the higher the value the more fine‑particle pollution there is.
Keep yourself updated – it could save your life!