Countries With the Most Olympic Gold Medals 2026: All-Time Ranking by Gold Medals
A gold medal from the Olympics is like a piece of history.
It represents one gold, one event, one athlete or team on the podium. When we count gold medals over many years they reveal a larger story about sport history, people, money, groups, places, coaches and how sport has grown worldwide.
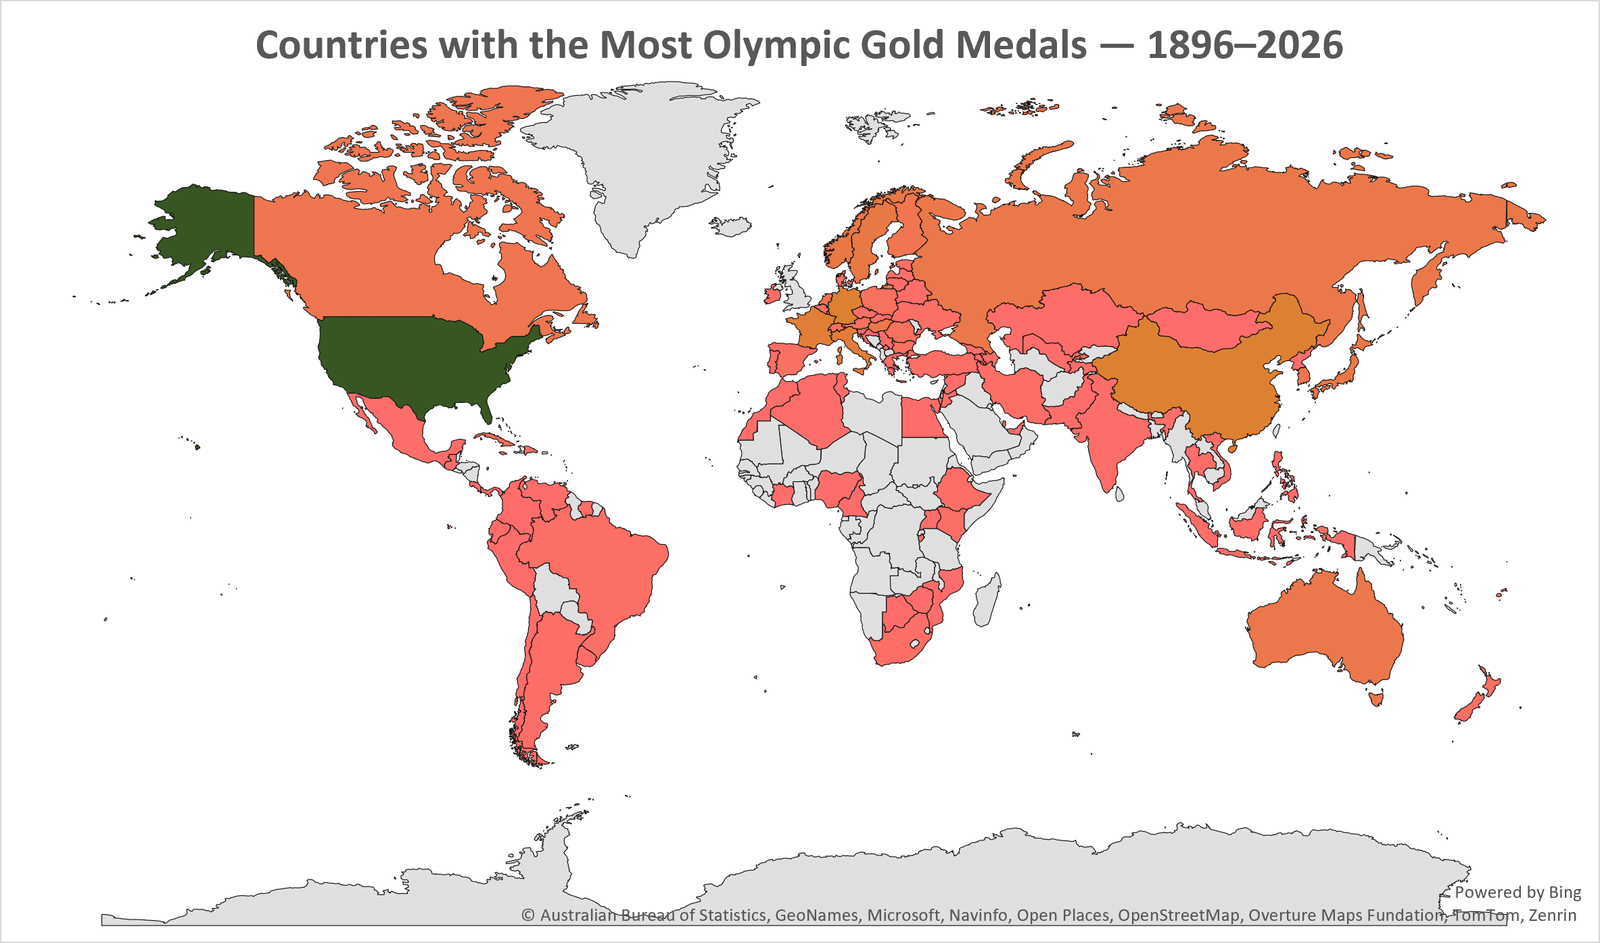
The Top Countries by Olympic Gold Medals 2026 ranking puts that history into an all‑time Olympic score list from the modern Games to the 2026 Winter Games.
There is a big twist.
It is not the same as the table that is shown after each Olympic Games. The order follows the country / NOC method that is used for recent medal rankings. It uses Summer gold medals from 1896 to 2024 together with Winter Olympic gold medals from 1924 to 2026. It does not automatically add medals earned by a NOC when a new country is formed. Dependent colonies are counted as part of the country and only countries that have at least one gold medal appear.
With that approach, the index contains 101 countries that have Olympic gold medals. The result, the statistics of Olympic champions.
It shows a skew at the top, a wider base of competitors below and a long tail of countries that have only a few Olympic gold medals.
More than anything the ranking shows how important it is to build a legacy of medals. One Games gives headlines but the all‑time table took many generations to create.
What Does “Most Olympic Gold Medals” Mean?
This step, which is probably the easiest is “literally as simple as can be”: add up all the gold medals that each existing nation or National Olympic Committee has won across all the Olympics then sort those totals from highest to lowest.
Now the historical part is where things get complicated.
The Olympic movement has seen a lot of change over the years—wars, revolutions, countries breaking apart, countries coming together, independence movements, boycotts, borders shifting and Olympic committees being reorganized. The team that once competed under an Olympic code 50 years ago, might not even exist today under that same name.
This creates a challenge.
Should the old medals move with the land? With the successor?. With the current Olympic committee?. Should each old National Olympic Committee always be treated as a separate distinct entity?
There is no correct answer that fits every situation.
For this Viz Atlas ranking, the method is deliberately cautious: current countries or National Olympic Committees count. Previous NOCs that no longer exist are not merged into the ones. Temporary teams and special delegations don’t count toward a country’s ranking.
This approach brings consistency to the list. It also means the numbers here might not match what you see in other Olympic medal tables.
That’s not a mistake. It’s the result of a specific choice.
| Rank | Country | Olympic Gold Medals |
|---|---|---|
| 1 | United States | 1,232 |
| 2 | China | 330 |
| 3 | Germany | 327 |
| 4 | Great Britain | 318 |
| 5 | France | 293 |
| 6 | Italy | 281 |
| 7 | Norway | 229 |
| 8 | Sweden | 224 |
| 9 | Japan | 211 |
| 10 | Russia | 192 |
| 11 | Australia | 189 |
| 12 | Hungary | 189 |
| 13 | Netherlands | 174 |
| 14 | Canada | 161 |
| 15 | Finland | 146 |
| 16 | South Korea | 145 |
| 17 | Switzerland | 122 |
| 18 | Austria | 97 |
| 19 | Romania | 93 |
| 20 | Cuba | 86 |
| 21 | Poland | 80 |
| 22 | New Zealand | 65 |
| 23 | Bulgaria | 58 |
| 24 | Spain | 55 |
| 25 | Denmark | 50 |
| 26 | Belgium | 49 |
| 27 | Brazil | 41 |
| 28 | Ukraine | 41 |
| 29 | Türkiye | 41 |
| 30 | Kenya | 39 |
| 31 | Greece | 36 |
| 32 | Czechia | 34 |
| 33 | South Africa | 28 |
| 34 | Jamaica | 27 |
| 35 | Iran | 27 |
| 36 | Ethiopia | 24 |
| 37 | Argentina | 22 |
| 38 | Belarus | 21 |
| 39 | Croatia | 20 |
| 40 | Uzbekistan | 19 |
| 41 | Kazakhstan | 17 |
| 42 | North Korea | 16 |
| 43 | Slovenia | 16 |
| 44 | Ireland | 15 |
| 45 | Slovakia | 14 |
| 46 | Estonia | 14 |
| 47 | Mexico | 13 |
| 48 | Georgia | 13 |
| 49 | Thailand | 11 |
| 50 | Indonesia | 10 |
| 51 | India | 10 |
| 52 | Azerbaijan | 9 |
| 53 | Egypt | 9 |
| 54 | Serbia | 9 |
| 55 | Morocco | 8 |
| 56 | Bahamas | 8 |
| 57 | Algeria | 7 |
| 58 | Portugal | 6 |
| 59 | Lithuania | 6 |
| 60 | Tunisia | 6 |
| 61 | Colombia | 5 |
| 62 | Latvia | 5 |
| 63 | Uganda | 5 |
| 64 | Israel | 4 |
| 65 | Dominican Republic | 4 |
| 66 | Ecuador | 4 |
| 67 | Pakistan | 4 |
| 68 | Bahrain | 4 |
| 69 | Nigeria | 3 |
| 70 | Chile | 3 |
| 71 | Venezuela | 3 |
| 72 | Trinidad and Tobago | 3 |
| 73 | Philippines | 3 |
| 74 | Zimbabwe | 3 |
| 75 | Cameroon | 3 |
| 76 | Kosovo | 3 |
| 77 | Mongolia | 2 |
| 78 | Armenia | 2 |
| 79 | Uruguay | 2 |
| 80 | Qatar | 2 |
| 81 | Fiji | 2 |
| 82 | Liechtenstein | 2 |
| 83 | Peru | 1 |
| 84 | Vietnam | 1 |
| 85 | Luxembourg | 1 |
| 86 | Singapore | 1 |
| 87 | Botswana | 1 |
| 88 | Jordan | 1 |
| 89 | Tajikistan | 1 |
| 90 | Grenada | 1 |
| 91 | Côte d’Ivoire | 1 |
| 92 | Costa Rica | 1 |
| 93 | Panama | 1 |
| 94 | Syria | 1 |
| 95 | Guatemala | 1 |
| 96 | Burundi | 1 |
| 97 | Saint Lucia | 1 |
| 98 | Mozambique | 1 |
| 99 | Suriname | 1 |
| 100 | United Arab Emirates | 1 |
| 101 | Dominica | 1 |
The First Big Pattern: Olympic Gold Is Highly Concentrated
The ratio of all-time gold medals to all-time medals has a large upper tail.
Not many previous countries have large percentage of all gold medals as the countries shown here. Then the curve drops sharply.
A row of nations with large amount of gold medals lies beneath the giants of Olympic competition. Below that a larger group of nations has dozens, teens or single digits of gold medals.
Finally the gold medal history of some countries is so short that it can be summed up in a one or two win.
The index form classic shape of a long‑tail distribution.
There is a core group that amassed hundreds of gold medals over the hundred-plus years with many more joining only in recent times.
It should not be surprising that there is such a difference when you think about the history of the Olympic Games.
Olympic success compounds.
Nations with existing sporting pipelines have had chances to build infrastructure, hire coaches, develop talent pools and send large delegations to successive Olympic Games.
Success creates experience. Experience creates systems. Systems create opportunities, for Olympic success.
Why the Top of the Ranking Is So Difficult to Dislodge
An all-time Olympic ranking has a huge biasness towards history.
A nation that has been in the 10 (or within the top 15) at the Olympics for 100 years will have had significantly more chances to win medals than a nation that has only recently (say, in the last 50 years) participated in the Olympics.
This creates what could be described as a compounding effect. This grows more layer one by one with each four-year cycle.
A nation that already has hundreds of gold medals doesn’t need to win a Games to stay close, to the top. It just has to keep churning out medals.
While a country which has gone in with a handful of the trophy can make a spectacular leap in a single Olympics and end up kilometres behind in the all-time table.
This is also the reason that the all-time rankings are not to be mixed up with Olympic success.
An all-time ranking measures accumulated history. A single-Games medal table measures performance. They answer questions.
The Olympic Gold Medal Is Not Just a Sporting Statistic
Behind every medal is an ecosystem.
It starts with athletes who need training facilities.
Coaches need expertise to guide them.
Young athletes need pathways into competitive sport.
National federations need funding to keep things running.
Elite athletes require care, nutritional support and psychological help.
International competition means travel, equipment and preparation.
Some sports have infrastructure costs high that they become nearly impossible to afford.
That connection shows how sporting success depends on strength. Money alone does not create Olympic champions. Sport is too unpredictable for that. Talent matters more, than anything. So does culture, coaching, opportunity, motivation, competition format and the rise of athletes.
Still over time small structural gains can add up. That’s one reason why the all-time medal table stays so unchanged.
The Geography of Olympic Success
Olympic success has a geography. Some countries have built sporting systems over time. Others have fewer Olympic winners.
Climate plays a role.
Winter sports need snow, ice, mountains or expensive artificial tracks. These conditions create limits. Such limits are not as strong for sports like swimming or track and field. Population matters too.
A larger population means more people to choose from when looking for athletes. It increases the chances of finding someone with potential.
Elite sport can be expensive. Training at that levels often requires good facilities, coaches, medical support and travel. Not every country can afford all of this.
There is sporting culture. In some places certain sports have roots. These traditions come with coaching systems, youth competitions and pathways that go back centuries. The culture supports talent from an age.
The map of the Olympics shows more than skill. It reflects institutions. Schools, clubs, training centers, government programs. It shows where effort, money and belief, in sport have been invested for generations.
Why Gold Is Different From Total Medals
Olympic rankings are usually reported in different forms. People often rank countries by the number of medals they win. Another way is to rank by the number of gold medals These two methods can give different results.
Gold medals show who wins at the top. Total medals show how deep a country’s performance is, across events.
A country can win a lot of medals but have few golds. Another country might win very few medals overall but have more golds.
If we are looking for an all-time ranking based on champions, gold medals are the clearest and simplest way to compare.
Gold alone should not be seen as the full measure of a country’s sporting success. The medal table has three parts:
Gold stands for first place.
Silver stands for Second place.
Bronze stands for Third place.
A gold- ranking ignores silver and bronze completely. This is not a mistake. It is a choice. It is a feature of the ranking method. It must be understood for what it is.
A Country Can Be Improving Rapidly Without Moving Much in the All-Time Ranking
This is one of the misunderstood pieces of information. You can imagine a nation earning gold medals at one Olympic Games. Its current performance can have improved a lot but it appear to barely move in an all-time ranking.
Why does that happen?
Only because the countries above them have earned medals for years. This shows the difference between velocity and stock. Current medal performance is a flow. The all-time gold-medal count is a stock.
A nation can have a high medal-winning velocity right now and still lead with only a small stock. Alternatively a nation can stay in the Top five of the all-time table even if its recent Olympics were not very good.
It is an accumulation math but it has surprising effects, on Olympic rankings.
What the Ranking Does Not Tell Us
The all-time Olympic gold medal ranking does not show the athletic ability in the most basic sense.
It is not a way to judge the qualities of athletes.
It does not count the performance of athletes.
It does not count how many athletes participate for each person in the country.
It does not count the medals earned by each athlete.
It does not count how much money or resources are put into sports.
It does not show how well a country does in any particular sport.
Can it separate the advantage of sports from the chances that history gave.
A country that has high population and many athletes will have a very different set of numbers than a small country that sends only a few athletes.
Also a country that focuses on sport with medal events can earn gold medals in many different ways but a country that focuses on only a few sports has a different path. The all-time Olympic gold medal ranking should be read as a record of how strong a country’s sports have become over time not as an all‑round score.
Conclusion: A Century of Olympic Success in One Ranking
Most Olympic Gold Medals by Country 2026 ranks the Countries With the Olympic Gold Medals, shows the story of sports history.
Using a current country/NOC method, the index includes 101 current countries that have at least one Olympic gold medal. It combines results from the Summer Olympics starting in 1896 up to 2024. The Winter Olympics starting in 1924 up to 2026.
That way, medals distribution is not even at all. Some strong countries have collected hundreds of gold medals over years while most countries have only a few. At the bottom of the list winning one Olympic gold can be a rare event. The 2026 Winter Games added 116 gold medal events.
The most important point to note is about the method. Deciding whether to include Olympic results is not important unless you first ask some key questions.
Should old NOCs be grouped together?
Should medals be assigned to borders?
Should temporary teams be counted?
Should special Olympic groups be included with countries?
These choices can change the numbers a lot. The VizAtlas method focuses on keeping things consistent of adding old data. Existing countries and NOCs are counted. Past NOCs are not linked back. Special teams are not added.
This creates a ranking that’s not just about listing names but about making the comparison clear. Because the Olympic medal table is more than numbers.
It tells the story of how sports developed, how countries changed, how many years an athletes competed and how long-standing rivalries grew.
One thing that really stands out is not the top number of gold medals. It is the gap between the top and the many countries still searching for their next Olympic gold or their first.
The Olympics is always creating history every time an athlete reaches first place. The all-time ranking just keeps the records.
Subscribe to our $1 newsletter to get new Data and Maps from around the world on various different topics every month. Click here now to join.
Source
- IOC all-time Olympic Games medal table, 1896-2026 (Summer Olympics through Paris 2024 and Winter Olympics through Milano Cortina 2026) which assigns medals to the IOC country/NOC code; does not combine current NOCs with previous/NOCs.
- Complete all-time medal database from on Olympedia with country/NOC level gold, silver, bronze and total counts.
Methodology
- Olympic Gold Medals Awarded = all gold medals earned by the country/NOC from 1896 through the end of the 2026 Winter Olympics.
Summer Olympics: 1896-2024
Winter Olympics: 1924-2026
Summer and Winter gold medals are combined. - Previous NOCs of history are not proceeded to countries at present. So the following countries/regions are not in the country ranking since they are being excluded from the country ranking and not included into the next country ranking: Soviet Union, East Germany, West Germany, Czechoslovakia, Yugoslavia, United Team of Germany, Unified Team and others of the NOCs.
- Special delegations ( Refugee Olympic Team, Mixed Team, ROC and Individual Neutral Athletes) are not allowed.
- The country- table does not include non-sovereign Olympic delegations/territories, like Hong Kong, Puerto Rico and Chinese Taipei.
- There are no countries that have not won a gold medal at the Olympics.
- Ranking is cumulative gold-medal count lowest.
- In the event that countries have the same number of medals, the countries stay in the same value group. No artificial differentiation is created.