Road Quality Around the World (2025–26): The Countries With the Best and Worst Roads
A road can be things at once. A road can be a piece of infrastructure. A road can be an artery. A road can be a source of frustration. A road can be the difference between a community being connected to opportunity or being cut off from it.
That is why road quality matters more than whether a highway looks smooth in a photograph.
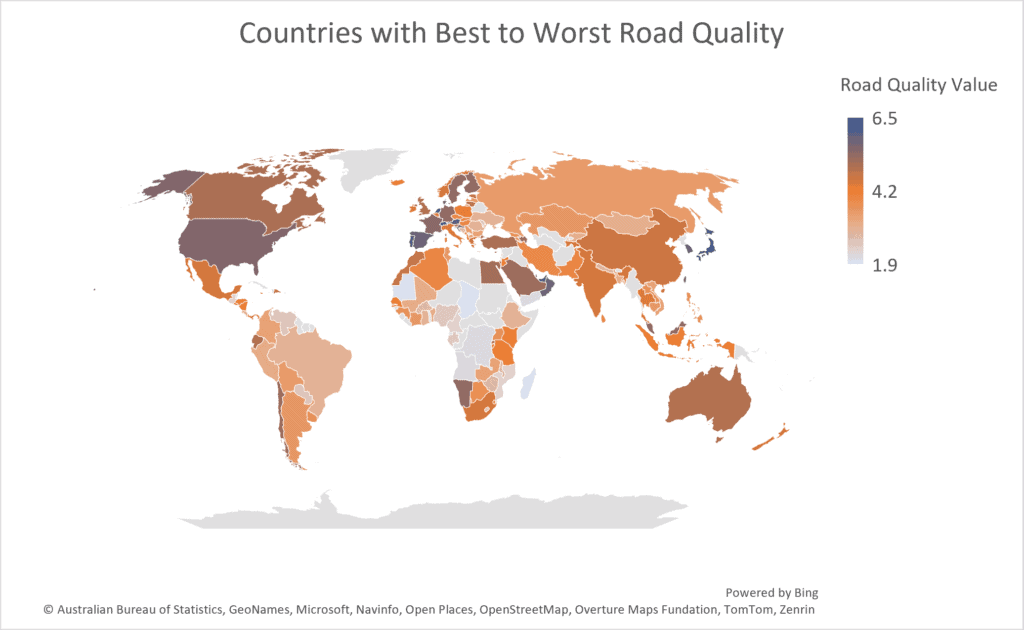
For the VizAtlas ranking of road quality 141 economies and territories are compared on a 1-to-7 road quality scale. Higher values on that scale mean Better road quality. Lower values on that scale mean Poorer road quality. The data puts Singapore first with a score of 6.5 followed by the Netherlands at 6.4 and Switzerland at 6.3. At the end Chad scores 1.9 while Mauritania and Madagascar both record 2.0.
The gap, between the top and bottom is enormous. The most interesting story is not simply who sits at No. 1.
What the ranking reveals is how geography, wealth, governance, urbanisation, climate, maintenance and many other challenges affect road quality. Some countries have road networks that’re easy to keep. Others face problems when trying to keep thousands—or millions—of kilometres of road usable.
What Does “Road Quality” Actually Mean?
Before looking at the ranking there is a distinction to make.
Road quality is not the thing as the size of a country’s road network.
A country can have thousands of kilometres of roads. Still have poor road quality. Likewise a smaller country can have a well-maintained network without having a particularly extensive one.
The road-quality measure used in this ranking is based on the type of 1–7 quality assessment historically used by the World Economic Forums Global Competitiveness Index, where respondents evaluated the quality—including the condition and extensiveness—of road infrastructure. A score of 1 represented poor road infrastructure while 7 represented extremely good infrastructure.
That distinction matters because this is fundamentally a measure of road-infrastructure quality than a simple calculation of kilometres of asphalt.
It is also why the ranking should not be interpreted as a live engineering inspection of every road, in 2025 or 2026.
The dataset supplied for this VizAtlas ranking contains 141 entries and uses the 1–7 road-quality scale. The underlying comparable road-quality series is associated with the World Economic Forums competitiveness data, whose latest full Global Competitiveness Report was published in 2019. The WEF subsequently produced a 2020 edition focused on recovery and transformation rather than continuing the same annual competitiveness ranking.
In words 2025–26 describes the VizAtlas ranking edition, not a claim that the underlying perception survey was conducted in 2025–26.
That methodological caveat is crucial.
| Rank | Country | Road Quality Value |
|---|---|---|
| 1 | Singapore | 6.5 |
| 2 | Netherlands | 6.4 |
| 3 | Switzerland | 6.3 |
| 4 | Japan | 6.1 |
| 5 | Hong Kong | 6.1 |
| 6 | Austria | 6.0 |
| 7 | Portugal | 6.0 |
| 8 | United Arab Emirates | 6.0 |
| 9 | South Korea | 5.9 |
| 10 | Oman | 5.7 |
| 11 | Spain | 5.7 |
| 12 | Croatia | 5.6 |
| 13 | Denmark | 5.6 |
| 14 | Taiwan | 5.6 |
| 15 | Luxembourg | 5.5 |
| 16 | Qatar | 5.5 |
| 17 | United States | 5.5 |
| 18 | France | 5.4 |
| 19 | Finland | 5.3 |
| 20 | Germany | 5.3 |
| 21 | Malaysia | 5.3 |
| 22 | Namibia | 5.3 |
| 23 | Sweden | 5.3 |
| 24 | Azerbaijan | 5.2 |
| 25 | Bahrain | 5.2 |
| 26 | Chile | 5.2 |
| 27 | Saudi Arabia | 5.2 |
| 28 | Cyprus | 5.1 |
| 29 | Egypt | 5.1 |
| 30 | Brunei | 5.0 |
| 31 | Canada | 5.0 |
| 32 | Türkiye | 5.0 |
| 33 | Australia | 4.9 |
| 34 | Ecuador | 4.9 |
| 35 | Israel | 4.9 |
| 36 | Slovenia | 4.9 |
| 37 | United Kingdom | 4.9 |
| 38 | Lithuania | 4.8 |
| 39 | Rwanda | 4.8 |
| 40 | Dominican Republic | 4.7 |
| 41 | Estonia | 4.7 |
| 42 | Mauritius | 4.7 |
| 43 | Morocco | 4.7 |
| 44 | China | 4.6 |
| 45 | Greece | 4.6 |
| 46 | India | 4.5 |
| 47 | Mexico | 4.5 |
| 48 | New Zealand | 4.5 |
| 49 | Norway | 4.5 |
| 50 | Panama | 4.5 |
| 51 | South Africa | 4.5 |
| 52 | Tajikistan | 4.5 |
| 53 | Belgium | 4.4 |
| 54 | Ireland | 4.4 |
| 55 | Italy | 4.4 |
| 56 | Thailand | 4.4 |
| 57 | Poland | 4.3 |
| 58 | El Salvador | 4.2 |
| 59 | Indonesia | 4.2 |
| 60 | Jordan | 4.2 |
| 61 | Nicaragua | 4.2 |
| 62 | Honduras | 4.1 |
| 63 | Iceland | 4.1 |
| 64 | Kenya | 4.1 |
| 65 | Senegal | 4.1 |
| 66 | Tanzania | 4.1 |
| 67 | Algeria | 4.0 |
| 68 | Cabo Verde | 4.0 |
| 69 | Hungary | 4.0 |
| 70 | Pakistan | 4.0 |
| 71 | Seychelles | 4.0 |
| 72 | Slovakia | 4.0 |
| 73 | Eswatini | 4.0 |
| 74 | Albania | 3.9 |
| 75 | Burundi | 3.9 |
| 76 | Czechia | 3.9 |
| 77 | Iran | 3.9 |
| 78 | Jamaica | 3.9 |
| 79 | Montenegro | 3.9 |
| 80 | Sri Lanka | 3.9 |
| 81 | Botswana | 3.8 |
| 82 | Georgia | 3.8 |
| 83 | Gambia | 3.7 |
| 84 | Guinea | 3.7 |
| 85 | Kuwait | 3.7 |
| 86 | Laos | 3.7 |
| 87 | Philippines | 3.7 |
| 88 | Trinidad and Tobago | 3.7 |
| 89 | Uganda | 3.7 |
| 90 | Uruguay | 3.7 |
| 91 | Argentina | 3.6 |
| 92 | Armenia | 3.6 |
| 93 | Cambodia | 3.6 |
| 94 | Côte d’Ivoire | 3.6 |
| 95 | Kazakhstan | 3.6 |
| 96 | Latvia | 3.6 |
| 97 | Tunisia | 3.6 |
| 98 | Bolivia | 3.5 |
| 99 | Russia | 3.5 |
| 100 | Serbia | 3.5 |
| 101 | Bulgaria | 3.4 |
| 102 | Colombia | 3.4 |
| 103 | North Macedonia | 3.4 |
| 104 | Vietnam | 3.4 |
| 105 | Zambia | 3.4 |
| 106 | Malta | 3.3 |
| 107 | Bangladesh | 3.2 |
| 108 | Barbados | 3.2 |
| 109 | Benin | 3.2 |
| 110 | Mali | 3.2 |
| 111 | Peru | 3.2 |
| 112 | Kyrgyzstan | 3.1 |
| 113 | Mongolia | 3.1 |
| 114 | Brazil | 3.0 |
| 115 | Costa Rica | 3.0 |
| 116 | Ethiopia | 3.0 |
| 117 | Ghana | 3.0 |
| 118 | Romania | 3.0 |
| 119 | Ukraine | 3.0 |
| 120 | Nepal | 2.9 |
| 121 | Bosnia and Herzegovina | 2.8 |
| 122 | Burkina Faso | 2.8 |
| 123 | Malawi | 2.8 |
| 124 | Zimbabwe | 2.8 |
| 125 | Lesotho | 2.7 |
| 126 | Lebanon | 2.6 |
| 127 | Moldova | 2.6 |
| 128 | Paraguay | 2.6 |
| 129 | Venezuela | 2.6 |
| 130 | Gabon | 2.5 |
| 131 | Nigeria | 2.5 |
| 132 | Cameroon | 2.4 |
| 133 | Guatemala | 2.4 |
| 134 | Mozambique | 2.4 |
| 135 | Angola | 2.2 |
| 136 | Democratic Republic of the Congo | 2.1 |
| 137 | Haiti | 2.1 |
| 138 | Yemen | 2.1 |
| 139 | Madagascar | 2.0 |
| 140 | Mauritania | 2.0 |
| 141 | Chad | 1.9 |
The Global Road Quality Ranking: The Top of the Map
Singapore sits at the top of the VizAtlas dataset boasting a road-quality score of 6.5.
This outcome is not surprising.
Singapore merges a high urban density with highly intensive infrastructure planning and maintenance. Its whole transport system runs inside a geographic area, which lets authorities coordinate road construction, maintenance, drainage, traffic management and urban development in a way that would be far harder in a large continental country.
The Netherlands follows with a road-quality score of 6.4 and Switzerland comes next at 6.3. Japan scores 6.1 tied with Hong Kong in the supplied dataset.
Austria and Portugal both achieve a road-quality score of 6.0 as does the United Arab Emirates. South Korea reaches 5.9 while Oman and Spain each record 5.7.
The pattern is immediately noticeable.
The upper end is dominated by economies that have either infrastructure institutions, substantial fiscal capacity, high urbanisation developed logistics systems or a mix of all four.
Yet geography still matters.
Switzerland for example confronts a different physical environment, than Singapore. Mountainous terrain makes road construction expensive and technically demanding. The Netherlands meanwhile must deal with a landscape where water management’s a continuous engineering challenge.
High road-quality therefore does not come from geography alone. It often emerges from the ability to continuously overcome obstacles.
We notice that the top twenty in the dataset are: Singapore, Netherlands, Switzerland, Japan, Hong Kong, Austria, Portugal, United Arab Emirates, South Korea, Oman, Spain, Croatia, Denmark, Taiwan, Luxembourg, Qatar, United States, France, Finland and Germany.
What stands out is the mixture.
There are developed European economies, advanced Asian economies, wealthy Gulf states and large developed countries.
The United States for example ranks 17th with a score of 5.5. Germany ranks 20th at 5.3.
We find this a useful reminder that economic size and road quality are not perfectly correlated. A country can be one of the world’s economies without ranking at the absolute top for road quality.
Why?
Because maintaining roads across a territory is fundamentally different from maintaining a compact network.
A road network spanning millions of kilometres has more exposure, to weather, traffic, ageing, construction delays and regional differences. Even a wealthy government can find it difficult to maintain every kilometre at the standard.
This is one reason why small wealthy economies can perform well on infrastructure-quality indicators.
The Big Pattern: Money Helps, But Geography and Governance Matter Too
If the ranking were simply an income table the results would be easier to explain. But they are not.
The broad link between development and infrastructure quality is obvious: countries with fiscal resources normally have more capacity to build and maintain roads.
The ranking contains plenty of evidence that money alone is not enough.
Rwanda for example appears at rank 39 with a score of 4.8— above many countries with considerably larger economies. Namibia reaches 5.3 and ranks 22nd. Azerbaijan scores 5.2. Morocco records 4.7.
These examples show that infrastructure outcomes can reflect public investment priorities, road‑management institutions, strategic corridors and geographic concentration much as national income alone.
There is another factor hiding behind the numbers: what the road network needs to accomplish.
A country whose economy depends heavily on moving goods from ports to centres has strong incentives to maintain major transport corridors.
A country with dispersed populations may face a very different problem: not simply keeping highways smooth but providing basic all‑weather connectivity, over enormous distances.
The same numerical score can therefore conceal different infrastructure realities.
Europe Dominates the Upper Half
Europe stands out near the top.
The Netherlands, Switzerland, Austria, Portugal, Spain, Croatia, Denmark, Luxembourg, France, Finland and Germany are all in the 20.
Down the United Kingdom is 37th with 4.9 Lithuania 38th with 4.8 Estonia 41st with 4.7 Greece 45th with 4.6 Norway 49th with 4.5 Belgium 53rd with 4.4 and Italy 55th with 4.4.
The distribution shows that in rich Europe road quality is not the same everywhere. Economic growth gives money to build roads. That does not automatically mean all roads will be the same.
Climate, terrain, past investment how old the roads are, how they are kept and how many cars drive on them all affect the picture. Road quality can also get worse in rich countries.
The World Economic Forum says that not enough investment in transport can make road quality worse showing that both public and private money must keep coming of building once and then forgetting.
That is probably the flashy lesson, in infrastructure economics:
Maintenance is also infrastructure.
Asia’s Infrastructure Powerhouses
Asia has some of the performers in the ranking.
Singapore is on top globally Japan is fourth Hong Kong is fifth South Korea is ninth. Taiwan is fourteenth. Malaysia is 21st with 5.3. China is 44th with 4.6 while India is 46th with 4.5. Thailand is 56th with 4.4 and Indonesia is 59th with 4.2.
The situation in Asia is not the same. Some countries have created very high-quality transport infrastructure while others are still dealing with growing demand, very large areas, tough geography or unequal development between different parts of the country.
China is an interesting example. Its score of 4.6 puts it below the countries for road quality even though it has invested a lot in highways and transport infrastructure. That does not mean China has an not developed road system. Quite the opposite. It shows the difference between building infrastructure on a scale and making sure the quality is uniformly good across a huge country.
The World Bank has also said that road quality is one part of transport performance. They say access, connectivity and the condition of structures need to be looked at along, with other parts of transport services.
Wealthy Countries Can Still Have Middling Rankings
One of the useful lessons from the ranking is that wealth does not automatically mean a spot in the top ten.
The United States comes in at 17th. Canada is 31st with a score of 5.0. Australia sits at 33rd scoring 4.9. New Zealand is 48th with a score of 4.5. Norway even though it is a developed country ranks 49th also at 4.5.
These are not countries that lack infrastructure. They show a kind of challenge. It is not about money alone. It is, about scale, climate and the cost of keeping things running.
Australia has a population and most of its economy in a few major areas but the country is huge. That means infrastructure has to stretch over distances. Canada has distances to cover. Harsh. Repeated freeze-thaw cycles damage roads and bridges. Maintaining roads there is expensive and hard. Norway has mountains, long winters and scattered communities. Keeping roads and power lines working is a task.
So infrastructure quality depends not on how rich a country is—but also on how hard the job of building and maintaining it really is.
The Middle of the Ranking Is More Competitive Than It Looks
The middle of the table is where the differences become surprisingly small. Countries around ranks 50 to 90 fall within a tight range—about 3.7 to 4.5.
Panama, South Africa and Tajikistan all have a score of 4.5. Belgium, Ireland, Italy and Thailand are just a bit lower at 4.4. Poland comes in at 4.3. Indonesia is at 4.2. Honduras, Iceland, Kenya, Senegal and Tanzania all score 4.1.
A large number of countries—Algeria, Cabo Verde, Hungary, Pakistan, Seychelles, Slovakia and Eswatini—have a score of 4.0. This clustering matters.
A one-position shift in the ranking doesn’t always mean a real-world difference in road conditions. If two countries are 0.1 points apart on a scale from 1, to 7 calling them very different would be misleading.
It feels clean to rank things. It feels like we’re organizing chaos into something. Real life doesn’t work that way. The world is messy.. So are the roads people drive on every day.
The Lower End: Where Infrastructure Constraints Become Visible
At the bottom of the ranking the scores drop quickly.
Nepal records a score of 2.9. Bosnia and Herzegovina Burkina Faso, Malawi and Zimbabwe are all at 2.8. Lesotho has a score of 2.7. Lebanon, Moldova and Paraguay each record 2.6. Gabon and Nigeria both reach 2.5. Cameroon, Guatemala and Mozambique score 2.4. Angola is listed at 2.2. The Democratic Republic of the Congo Haiti and Yemen are all at 2.1. Madagascar and Mauritania each record 2.0. Chad ranks last with a score of 1.9.
At this end of the scale road quality can be limited by several factors: limited fiscal resources, difficult geography, extreme weather, conflict, weak maintenance capacity, sparse populations and insufficient transport investment.
Even in these cases the ranking should not be seen as a final judgment on every single road in a country. National averages can mask areas of infrastructure just as easily as they can hide roads that are, in very poor condition.
The Most Interesting Finding: There Is No Single “Perfect Road Country”
Singapore’s position at the top might seem like the result of the ranking. The real message is more involved.
The Netherlands, Switzerland, Japan, Austria, Portugal, the UAE and South Korea all end up in the group through very different geographic and economic situations.
There is no one way to do it. Singapore shows the benefits of size and careful planning. The Netherlands shows what steady and long-term work on infrastructure can do in a place that’s mostly below sea level. Switzerland shows that having mountains does not stop the building of roads. Japan shows how engineering and long-term care, for infrastructure can work in a place that is not easy to build in.
The thing that all of them have in common is not where they are located. It is ability: the ability to plan, fund, build, check and take care of infrastructure for years.
What the Data Does Not Tell Us
This may be the important part of the ranking. The dataset does not give us the condition of every road in 2025 or 2026. It does not count potholes with satellite imagery. It does not compute the number of years since a road was resurfaced. It does not measure driving safety. It does not give us journey times. It does not separate roads from rural roads.
Because the underlying road‑quality measure comes from a perception‑based international competitiveness dataset the score should be seen as an assessment of road infrastructure not a literal engineering measurement.
The World Bank has noted limits in international infrastructure comparisons like differences, in definitions how data is collected and coverage. There is another issue: the data is not equally up‑to‑date everywhere.
A country’s infrastructure can change a lot after a highway programme an economic crisis, a natural disaster, conflict or a time of underinvestment.
Therefore the VizAtlas 2025–26 ranking should be read as a benchmark made from the supplied dataset—not as a claim that every road condition shown by the scores is frozen in time. That distinction makes the ranking useful not less.
Conclusion: The World Is Connected by Roads—and Divided by Their Quality
The 2025–26 VizAtlas ranking shows a world where road quality differs a lot. Singapore tops the 141‑entry ranking with a score of 6.5 while Chad sits at 1.9. The gap between those two scores means more about road quality than asphalt.
It reflects decades of investment, planning, engineering, maintenance, geography, public administration and economic capacity.
The ranking also challenges a simple assumptions.
The richest countries do not automatically occupy every position. Large countries face infrastructure challenges that small countries can avoid. A huge road network is not necessarily a high road quality network.. A national average can hide enormous regional differences.
Importantly road quality is not a static achievement. Road quality that is excellent today can decline tomorrow. Road quality that ranks in the middle today can climb rapidly after investment. A country that reaches the top cannot simply stop maintaining what it has built.
The real infrastructure advantage is not simply having good road quality. It is having the institutions and resources necessary to keep road quality good. That may ultimately be the revealing number, about road quality of all.
Subscribe to our $1 newsletter to get new Data and Maps from around the world on various different topics every month. Click here now to join.