Top 50 Most Powerful Countries (2025–2026): What the Global Power Index Reveals About the World
Power has always been hard to measure.
For a time the easiest way to see how strong a country was was to look at how many soldiers it had, how many ships, how much land and how much money.. Now that way of thinking doesn’t work anymore. A country might have an economy but not much military power. Another might have military forces but not a big economy. A third might have a lot of influence because of technology or how it talks to countries or how it handles money or where it is located or how much people like its culture. None of these countries are the best in every area.
That is the challenge— The interest—behind the Top 50 Most Powerful Countries (2025–2026) index.
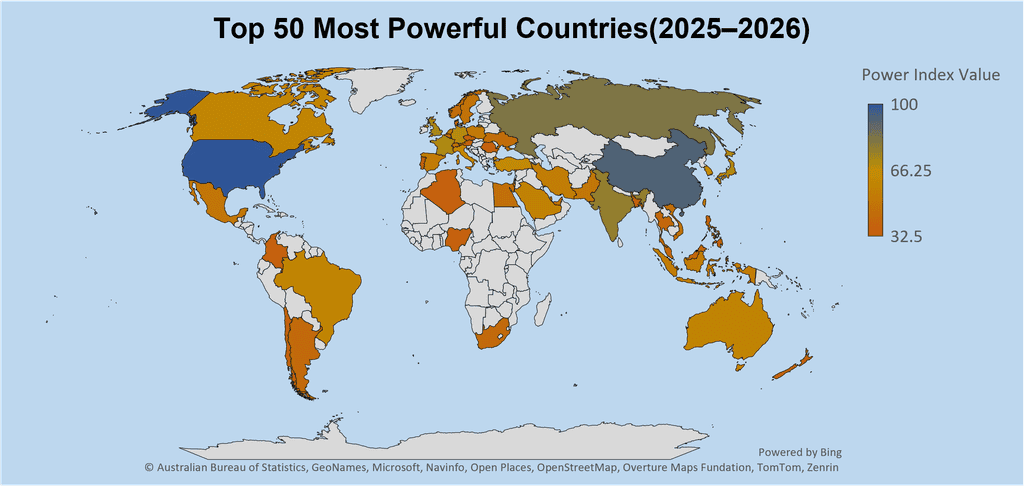
The VizAtlas ranking tries to take this situation and put it into one number called the Power Index Value. This number helps compare how powerful each of the 50 countries is. The country that is number one gets a value of 100.0. The country that is number 50 gets a value of 32.5. The average score for all 50 countries is 51.1. The middle score is 47.7.
What this shows is a world where power’s very strong at the top but it spreads out more as you go down the list. The numbers also show something important. Today power is not about having things. It is, about being able to use those things to get influence.
What Does a “Powerful Country” Actually Mean?
A powerful country is not always the one with the people, the highest economic output, the strongest army or the richest natural resources.
True national power is better seen as a country’s ability to affect events outside its borders to defend its interests to shape what others do and to react well when faced with global challenges.
This wider view matches how modern research on power is now being done. The Lowy Institute for example describes power as a state’s ability to influence countries and non-state groups as well as the direction of world events. Their 2025 Asia Power Index uses eight areas and 131 specific points to measure how strong different countries are.
This way of thinking matters because todays global competition happens in places at once.
Economic strength brings money and tools. Military power offers protection and the ability to force others to change. Technology can give advantages in both industry and strategy. Diplomacy builds relationships and support. Access, to networks gives countries reach into markets and international systems. Cultural influence makes a country appealing, not just strong. Resilience counts too.
A country might seem powerful when times are good. If it breaks down during an economic slump, a war, supply issues or a sudden political shock then its actual power could be much less than its numbers suggest.
In short national power comes from both what a country has and what it can actually do with those things.
The Data Behind the 2025–2026 Ranking
| Rank | Country | Power Index Value |
|---|---|---|
| 1 | United States | 100.0 |
| 2 | China | 92.4 |
| 3 | Russia | 81.6 |
| 4 | India | 76.8 |
| 5 | United Kingdom | 71.9 |
| 6 | France | 70.8 |
| 7 | Japan | 69.7 |
| 8 | Germany | 68.5 |
| 9 | South Korea | 64.9 |
| 10 | Türkiye | 62.7 |
| 11 | Italy | 60.8 |
| 12 | Canada | 59.6 |
| 13 | Brazil | 58.7 |
| 14 | Australia | 57.9 |
| 15 | Saudi Arabia | 56.8 |
| 16 | Israel | 55.9 |
| 17 | Iran | 54.2 |
| 18 | Indonesia | 53.8 |
| 19 | Spain | 52.9 |
| 20 | Poland | 51.7 |
| 21 | Netherlands | 50.9 |
| 22 | Pakistan | 50.3 |
| 23 | Mexico | 49.6 |
| 24 | Taiwan | 48.8 |
| 25 | Switzerland | 47.9 |
| 26 | Sweden | 47.5 |
| 27 | United Arab Emirates | 46.8 |
| 28 | Singapore | 46.2 |
| 29 | Egypt | 45.6 |
| 30 | Vietnam | 44.8 |
| 31 | Ukraine | 44.3 |
| 32 | Norway | 43.9 |
| 33 | Belgium | 42.7 |
| 34 | Argentina | 42.1 |
| 35 | South Africa | 41.7 |
| 36 | Thailand | 40.4 |
| 37 | Malaysia | 39.8 |
| 38 | Denmark | 39.4 |
| 39 | Qatar | 38.3 |
| 40 | Austria | 37.8 |
| 41 | Nigeria | 36.9 |
| 42 | Algeria | 36.4 |
| 43 | Philippines | 35.8 |
| 44 | Colombia | 35.2 |
| 45 | Bangladesh | 34.7 |
| 46 | Chile | 34.2 |
| 47 | Czechia | 33.8 |
| 48 | Romania | 33.4 |
| 49 | Portugal | 32.9 |
| 50 | New Zealand | 32.5 |
The VizAtlas dataset has 50 ranked entries. The Power Index Values go from 100.0 to 32.5. The average score in the ranking is 51.124. The middle value is 47.7. The standard deviation is 15.5 points. This shows there is a difference between the countries in the dataset.
The way the scores are spread out becomes more interesting when the ranking is split into performance groups.
Eleven of the 50 entries have scores of 60 or more. Twenty-two have 50 or more. This means less than half of the countries in the ranking have a score above 50. Fourteen have than 40.
The difference between the top and the bottom is 67.5 points. That is a large range.
There is an important thing to keep in mind before taking those numbers too seriously. The spreadsheet provided has the rank, the country and the Power Index Value.. It does not include the basic parts, the individual weights, the way the numbers are adjusted or the calculation sheet.
Because of this, this article looks at the Power Index as a VizAtlas ranking. It looks at what the distribution of the scores tells us. It does not create a way to weight the components that’s not in the data provided.
The Global Power Pyramid Is Steeper Than It First Appears
When we look at the top of the ranking a clear pattern emerges. The five highest scores average 84.5. The top ten average 75.9. The bottom ten average 34.6.
That means the average score of the ten is more than twice the average score of the bottom ten. The gap is not merely statistical.
It reflects the concentration of resources capable of generating international influence.
The states occupying the positions tend to combine several forms of strength simultaneously: substantial economic resources, military capability, technological capacity, diplomatic networks, international connectivity and the institutional ability to mobilize those resources. The crucial word is combine.
A country does not reach the levels of comprehensive power simply by being exceptionally good at one thing. It needs breadth. That is why national power is better visualized as a pyramid than as a ladder.
At the top are states with broad capabilities. Below them are powers, with strong but more uneven portfolios.
Down are middle powers whose influence may be considerable but concentrated in particular areas.
At the end of this particular top-50 universe are countries that remain internationally relevant but possess fewer dimensions of power at the same scale.
Economic Strength Is the Foundation—but Not the Whole Structure
Economic strength is probably the thing to notice when looking at national power.
A big and strong economy gives governments money from taxes the ability to invest, money for research spending on roads and buildings and the power to keep up with diplomatic needs. It also helps a country have influence around the world.
A nation that has companies, banks, industries that sell things abroad money reserves, investment connections or a currency that is very important can affect what happens without using the army.
The IMFs April 2026 World Economic Outlook database shows how wide the problem of measuring the economy really is. It has data about how much a country produces how prices go up how many people are not working how much money comes and goes, how much the government spends, trade information and other big numbers. It has data and predictions for many years.
Just looking at GDP does not explain all of national power. A country can have an economy but not have much say in world affairs. Another country might have an economy but be very important because of where it is the technology it has the energy it has or its military strength.
Economic size is best thought of as fuel for power not power itself. The engine still matters. So does the car. So does the drivers skill, in using it.
Military Capability Remains a Major Pillar of Power
If economic power provides resources, military capability determines how effectively a state can protect its interests when diplomacy fails.
The modern military balance is also becoming more expensive.
SIPRI estimates that global military expenditure reached $2.887 trillion in 2025 marking the straight year of growth. Global military spending was equivalent to about 2.5% of world GDP while spending per person reached $352. That increase is significant for any assessment of power.
Military capability is not about troop numbers. Modern military strength depends on logistics, readiness, intelligence, air power, naval reach, missile systems, cyber capabilities, space assets, industrial capacity, command structures and the ability to sustain operations. Nuclear weapons add another layer.
A small conventional force can possess enormous strategic significance if it is backed by a credible nuclear deterrent. Conversely a large military may have limited global reach if it lacks logistics, advanced technology or financial sustainability.
This is why military spending is useful but imperfect as a proxy, for power. Money buys capability. It does not automatically buy effectiveness.
Technology Has Become a Power Multiplier
Perhaps the biggest shift in what we mean by power over the last few decades has been the rise of technology.
A country doesn’t have to lead in every area of technology to gain an edge. Even leadership in one key field—like semiconductors, artificial intelligence, telecommunications, aerospace, biotechnology, advanced manufacturing or cybersecurity—can shape both economic success and military strength.
Technology builds on itself.
When a country has a research environment it produces more skilled workers. Those skilled workers draw in investment. Investment helps companies grow stronger. Strong companies create property. That intellectual property leads to exports. Gives a country more strategic influence.. Those exports can be used to fund even more research.
It’s a cycle that feeds on itself.
That’s why today’s measures of power increasingly take technological strength into account. Think about how the Lowy Institute calculates capability. They include sophistication in their assessment. They look at things like labor productivity, high-tech exports, research and development spending and the quality of infrastructure.
The lesson, for the VizAtlas ranking is clear: future power will depend more and more on the ability to turn strength into real economic and strategic power.
Diplomacy Turns National Strength Into International Influence
Raw resources are not enough.
A country can possess economic and military capabilities and still struggle to translate those capabilities into international influence if that country lacks diplomatic relationships.
Diplomatic power operates through embassies, alliances, international organizations, negotiations, trade relationships, aid, peacekeeping, strategic partnerships and political credibility.
Diplomatic power is therefore a form of network power.
A country with relationships can often accomplish more with the resources that country has than a country that operates largely alone.
The Lowy Institutes framework explicitly separates resources from influence. Examines how states convert capabilities into outcomes. The “Power Gap” concept is particularly useful because it recognizes that countries can overperform or underperform relative to the resources that country possesses.
That idea is crucial, for understanding any ranking of power. Having power and using power are not the same thing.
Soft Diplomacy Is the Invisible Layer
There is another kind of power that cannot be measured in tanks, GDP numbers or diplomatic missions.
It is attraction.
Countries influence others through universities, entertainment, brands, tourism, education, culture, sport, media, innovation and reputation.
Soft power can affect where people study, where companies invest which products consumers trust and which countries governments want to associate with.
Brand Finance‘s Global Soft Power Index offers one of the international attempts to quantify this dimension evaluating national reputation and influence in all UN member states.
This matters because global influence increasingly works through both persuasion and coercion. The versatile states can do both.
States can negotiate when negotiation works apply pressure when necessary build alliances when useful and attract foreign talent and investment through reputation.
That combination creates a broader form of national power, than military strength alone.
The Big Pattern: Power Is Becoming More Multidimensional
The important pattern in the 2025–2026 dataset is that comprehensive power rewards breadth.
The countries that score highest are those that perform well in areas at once. They do not depend on one strong point. Instead they show strength across categories.
This difference is key. It separates power from comprehensive power.
One country might be a leader in energy.
Another might be a financial hub.
Another could have the military.
Another might lead in a technology.
Another might have a population.
A country that is strong in economics, defence, technology, diplomacy, connectivity and resilience has far more options. It can act in ways, at once.
That is why the top ranks are so hard to reach. The top positions are not won by one engine. They require engines to run together. All of them must work at the time.
The Middle of the Ranking Is Where Competition Gets Interesting
The data gets especially tight in the middle.
The 20th ranked country scores 51.7 while the 30th-ranked country scores 44.8. By the 40th position, the score has dropped to 37.8 and the last entry scores 32.5.
The score differences between neighbouring positions are usually modest. That carries an editorial implication.
A ranking can make a 19th-place country look more powerful than a 20th-place country even when the scores of those two countries differ by less than one point.
Numbers create hierarchy. Reality often creates clusters.
The same principle applies to the table. A few tenths of a point should not automatically be taken as a geopolitical difference.
The ranking is best seen as a map of relative power not as a precise instrument that can prove that one country is exactly 1.1 points more powerful, than another.
Why the Top of the Ranking Is So Difficult to Challenge
The concentration of power is even clearer when the scores are put together.
The top five entries make up 16.5% of the total score from all 50 ranked entries. The top ten make up 29.7%. The top twenty make up 51.7%. In other words, the upper 40% of the ranking gives more than half of the total index value.
That is a concentration of power.
The observation shows that comprehensive national power behaves differently from ordinary rankings. The gap between powers and middle powers is more than just an order; it can show how many areas a state has real global influence.
This is why the international system can have influential states yet still be ruled by a small group of very powerful ones.
Historical Context: From Armies to Systems
The meaning of power has changed a lot.
In the Industrial age, power was closely linked to land, people, natural resources, industrial output and military production.
The two world wars showed how much economic and industrial strength could decide results.
The Cold War added another layer, with deterrence, ideological battles, tech rivalry and alliance networks at the heart of international power.
After the Cold War, globalization, financial links and complex supply chains entered the picture.
Today the picture is more complicated. Semiconductors can have importance. Energy infrastructure can become leverage. Digital platforms can shape information environments. Undersea cables can become infrastructure. Satellite networks can shape economic capabilities. Artificial intelligence can affect both productivity and national security.
The result is a world where the line, between power, tech power and military power is becoming increasingly blurred.
Global Military Spending Shows Why the Balance Is Moving
The wider international situation is also growing more competitive.
SIPRIs recent data show that global military spending went up by 2.9% in real terms during 2025 hitting the highest point in its entire history. Spending went up a lot in Europe and Asia and Oceania.
This is important for the future of any full-scale power ranking.
Military strength takes years to build. Planes, ships, missiles, satellites, factories and high-tech weapon systems need time to get. So the military spending today can affect the balance of power tomorrow.
The same is true for research and development. A country that puts a lot of money into manufacturing, artificial intelligence or chip technology today may not seem much more powerful right away.. If that investment builds a tech environment over the next ten years the strategic results could be much bigger.
Power rankings are therefore pictures of a changing system.
Connectivity Is a Powerful. Not Well Recognized Source of Power
One of the obvious parts of national power is connectivity.
A country that is connected to trade routes, financial markets, air travel networks, technology systems and international organizations has more chances to affect events.
Connectivity can make geography into an advantage. Harbors, airports, shipping companies, financial centers, telecom networks and transport facilities can all bring value.
The Lowy Institute includes connectivity directly in its economic capability model and looks at how countries link to and shape the global economy through trade, investment, merchant shipping and air travel.
This shows an idea for understanding the VizAtlas map:
Power is partly, about where a country is located in the worlds networks.
A country does not have to control the network to be influential. Sometimes just controlling a point is enough.
Resilience May Determine the Power of Tomorrow
One more thing needs our focus is resilience. Resilience Could Decide the Strength of the Future. Power that breaks when things get tough, is power.
Economic downturns, conflicts, health crises, extreme weather, energy problems and issues with getting supplies can show flaws that regular measures don’t catch.
Resilience means having money, good government systems, safe energy, enough food being able to make technology on your own having a strong industry and being able to bounce back from big problems.
This is becoming more and more important because how countries compete is not through fighting anymore.
Economic penalties, rules on what can be sold, attacks on computers, limits on supplies and money pressure, can all test how strong a country really is.
A nation that can handle these problems without any problems has a strong type of power.
What the Numbers Don’t Show Us
The VizAtlas Power Index is helpful because it makes a complex topic easier to understand.
Making it simple has its limits.
The Table provided does not show the parts used to calculate each Power Index score. It does not explain how much economic strength matters compared to strength how soft power is measured, how diplomatic influence is adjusted or how resilience is worked out.
These missing details mean the scores should not be seen as numbers like GDP or military spending.
A number like 76.8 doesn’t mean a country has 76.8% of the worlds power. It’s a score. The number 100 is the starting point and other scores show where countries stand compared to each other.
The index also doesn’t look at happiness, how people live, how democratic a country is, how well it takes care of the environment or how well its people are treated.
A strong country can still have issues at home. At the same time, a country that is not as strong can offer its people a very good life.
Power and good living conditions sometimes match but they are not the same thing.
International power can change fast after a war, a problem, a big invention or a major change in politics. So a ranking from 2025 to 2026 should be seen as a picture of the situation, at that time not as a lasting list.
Conclusion: Power Is No Longer About Having the Most—It Is About Being Able to Do the Most
The Top 50 Most Powerful Countries (2025–2026) index shows a world where power is concentrated but power is not static.
The 50 ranked entries range from a Power Index Value of 100.0 to 32.5 with an average of 51.1 and a median of 47.7. Eleven entries reach least 60 while fourteen entries fall below 40.
Those numbers show a hierarchy of power. They also show why that hierarchy of power exists. Modern national power is like an ecosystem.
Economic strength gives resources. Military strength gives deterrence. Technology multiplies capacity. Diplomacy turns resources into relationships. Soft power creates attraction. Connectivity gives leverage. Resilience decides whether those advantages survive a crisis.
No single number can capture all of that perfectly. Yet a carefully made index can reveal the underlying pattern of power.
And the pattern is clear: the countries that sit at the top of power are not always the ones with the most of a single resource. They are the countries that can blend size, military strength, technology, diplomacy, influence, connectivity and resilience into lasting international leverage.
That is the meaning of comprehensive national power. The global balance is not a fixed scoreboard of power. It is a competition between systems of power.
And as technology, economics and geopolitics become more intertwined the powerful countries of the future will be those that can turn resources into influence faster more efficiently and more resiliently, than their competitors.
That is where the next chapter of the power map will be written.
Subscribe to our $1 newsletter to get new Data and Maps from around the world on various different topics every month. Click here now to join.
Sources
Methodology
The VizAtlas Global Power Index (2025–2026) is a score from 0, to 100. The highest score, 100 shows the overall national power.
| Component | Weight |
|---|---|
| Economic Power | 25% |
| Military & Strategic Power | 25% |
| Diplomatic & Geopolitical Influence | 15% |
| Technological & Industrial Power | 15% |
| Soft Power & Global Influence | 10% |
| Strategic Resources & National Scale | 10% |
| Total | 100% |